Skip to content
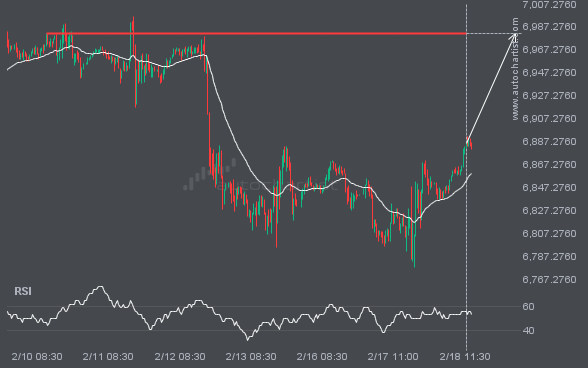
 S&P500 is heading toward 6982.0000 and could reach this level within the next 2 days. It has tested this level numerous times in the past, and this time could be no different, ending in a rebound rather than a breakout. If a breakout does not occur, we may see a retracement back to current levels.
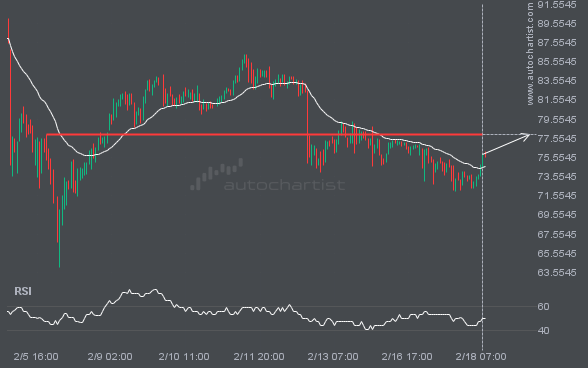
XAGUSD is moving toward a level at 77.8975, which it has tested many times before. We have seen it retrace from this level before, so at this stage it isn’t clear whether it will break through this price or rebound again. If XAGUSD continues on its current trajectory, we may see it move toward 77.8975 […]
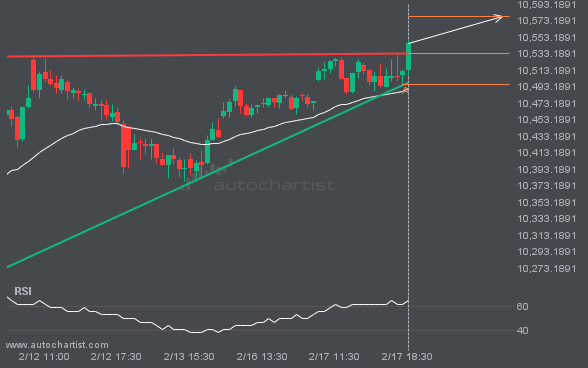
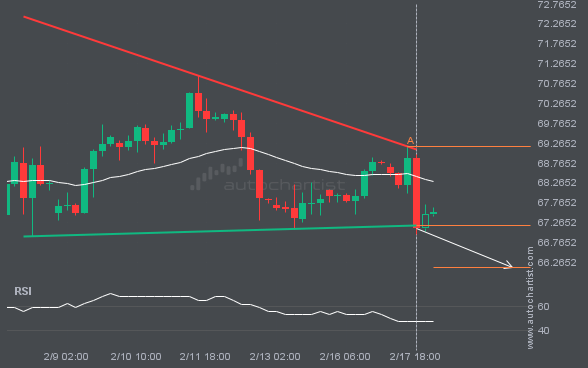
GBPJPY is moving toward a support line. Since it has retraced from this line before, we may see either a breakout through this line or a rebound to current levels. It has touched this line numerous times in the last 13 days and may test it again within the next 2 days.
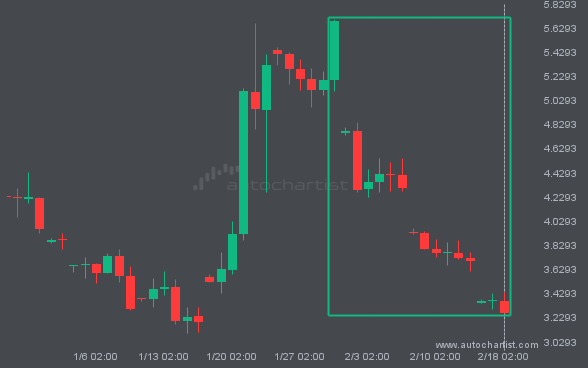
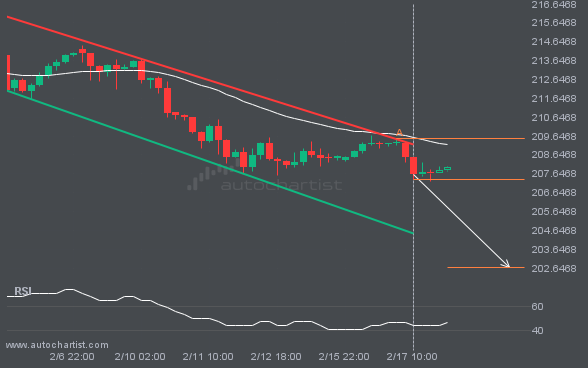
The last 12 4 hour candles on BRN/USD have formed a Descending Triangle pattern and broken out through the pattern lines, indicating a possible bearish movement toward the price level at 66.1395.
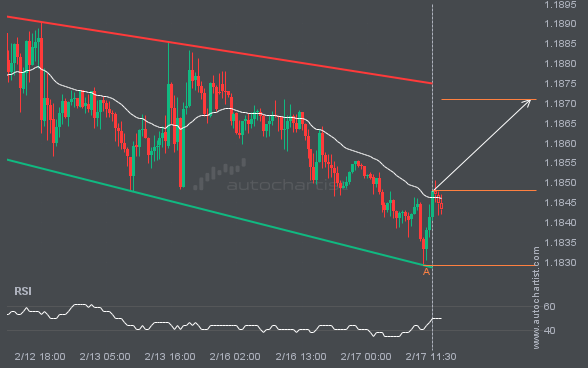
The movement of EURUSD toward the resistance line of a Channel Down is yet another test of the line it has reached numerous times in the past. This test of the line could occur within the next 20 hours, but it is uncertain whether it will result in a breakout through this line or simply […]