 Skip to content
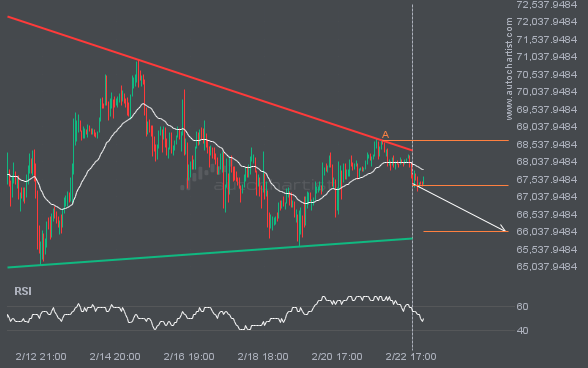
 BTCUSD is heading toward the support line of a Triangle pattern and could reach it within the next 3 days. It has tested this line numerous times before, and this time may be no different, ending in a rebound instead of a breakout. If a breakout doesn’t occur, we could see a retracement back to […]
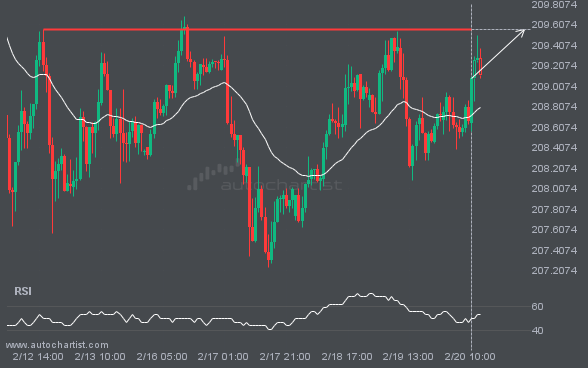
GBPJPY is approaching a critical level that could be a key deciding factor for what comes next. We may see this trajectory continue to test and break through 209.5580, unless it loses momentum and pulls back to current levels.
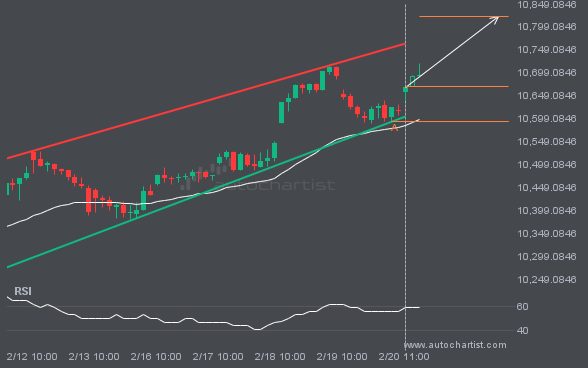
The movement of FTSE100 toward the resistance line of a Channel Up is yet another test of the line it has reached numerous times in the past. This test of the line could occur within the next 15 hours, but it is uncertain whether it will result in a breakout through this line or simply […]
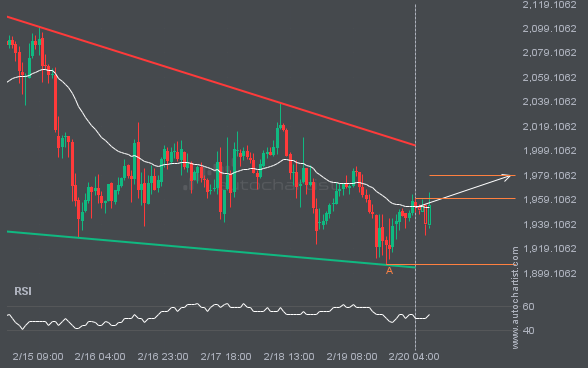
ETHUSD is moving toward a resistance line. Since it has retraced from this line before, we may see either a breakout through this line or a rebound to current levels. It has touched this line numerous times in the last 8 days and may test it again within the next 2 days.
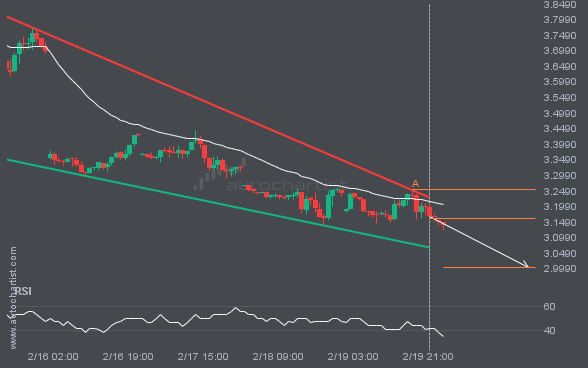
NGC/USD is heading toward the support line of a Falling Wedge pattern and could reach it within the next 2 days. It has tested this line numerous times before, and this time may be no different, ending in a rebound instead of a breakout. If a breakout doesn’t occur, we could see a retracement back […]
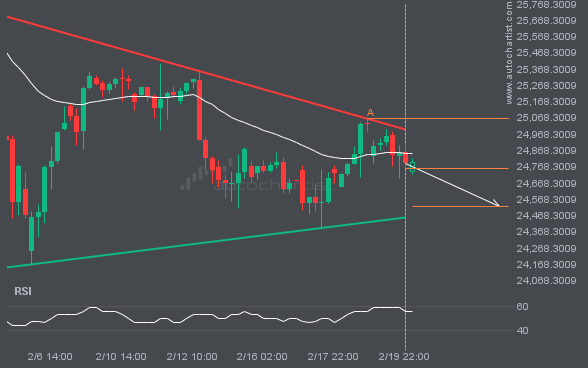
NAS100 is trapped in a Triangle formation, implying that a breakout is imminent. This is a strong trade setup for both trend and swing traders. It is now approaching a resistance line that has been tested before. Divergence watchers may be optimistic about a potential breakout, which could mark the start of a new trend. […]
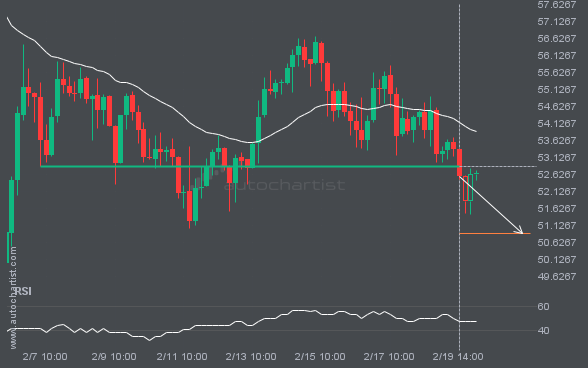
LTCUSD has broken through a support line. Because it has previously retraced from this price, you should wait for confirmation of the breakout before trading. It has touched this line multiple times over the past 13 days, which suggests a possible target around 50.9000 within the next 3 days.

