Skip to content
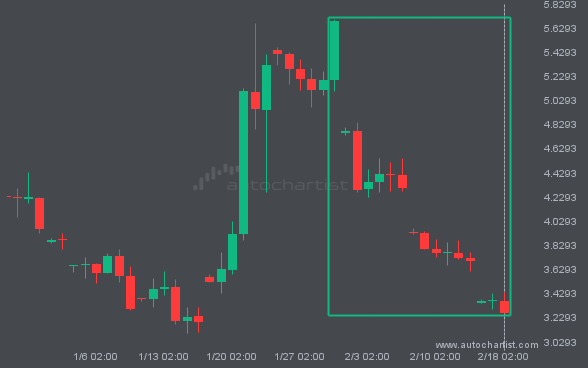
 LTCUSD is trapped in a Falling Wedge formation, implying that a breakout is imminent. This is a strong trade setup for both trend and swing traders. It is now approaching a resistance line that has been tested before. Divergence watchers may be optimistic about a potential breakout, which could mark the start of a new […]
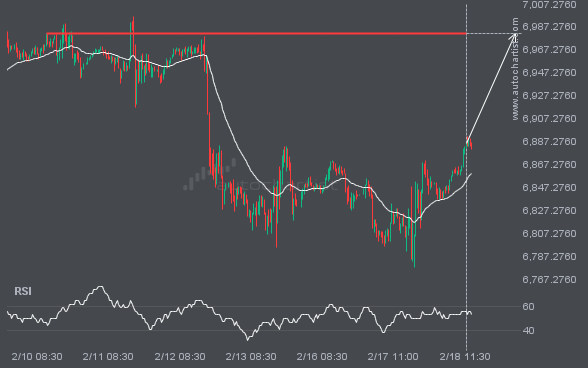
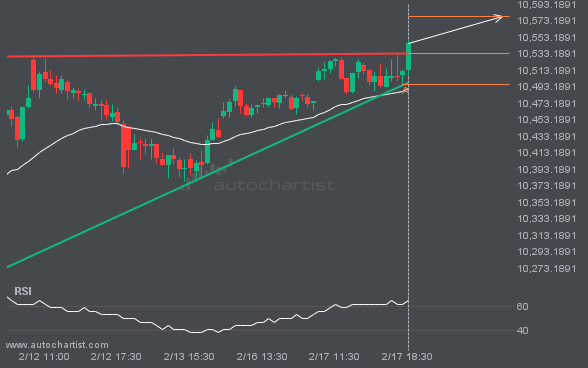
S&P500 is heading toward 6982.0000 and could reach this level within the next 2 days. It has tested this level numerous times in the past, and this time could be no different, ending in a rebound rather than a breakout. If a breakout does not occur, we may see a retracement back to current levels.
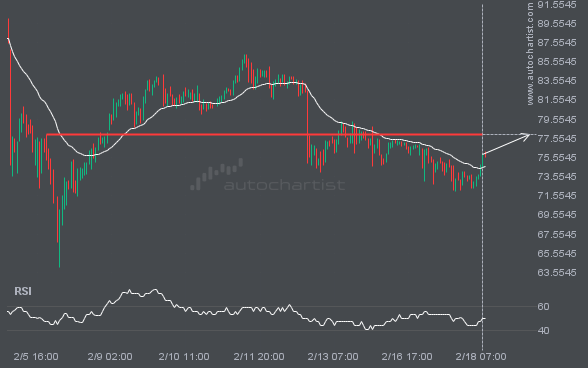
XAGUSD is moving toward a level at 77.8975, which it has tested many times before. We have seen it retrace from this level before, so at this stage it isn’t clear whether it will break through this price or rebound again. If XAGUSD continues on its current trajectory, we may see it move toward 77.8975 […]
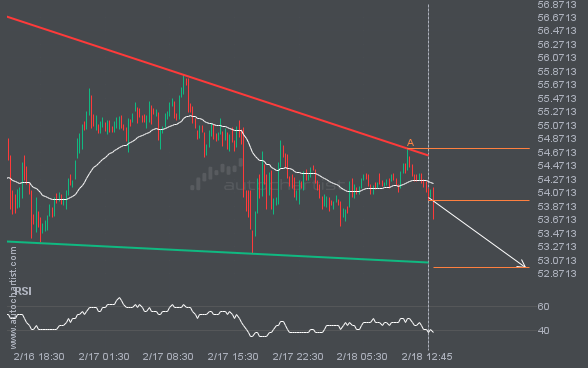
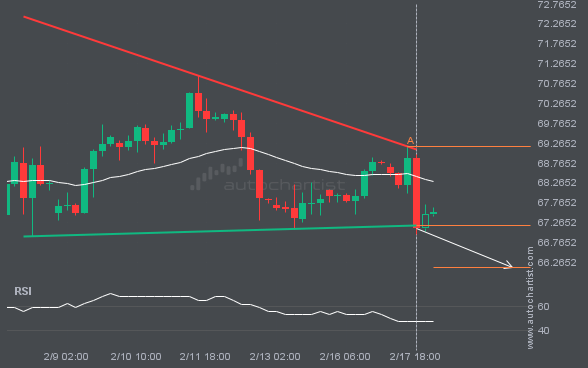
GBPJPY is moving toward a support line. Since it has retraced from this line before, we may see either a breakout through this line or a rebound to current levels. It has touched this line numerous times in the last 13 days and may test it again within the next 2 days.
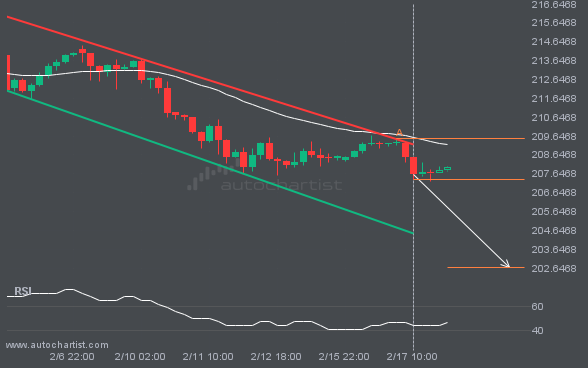
The last 12 4 hour candles on BRN/USD have formed a Descending Triangle pattern and broken out through the pattern lines, indicating a possible bearish movement toward the price level at 66.1395.
By Laurence Fish, Developer, Autochartist.com Price data is central to our business in the drawing of the charts and the
By Robain Polly, Product Evangelist and Resident Snake Charmer, Autochartist.com I collect venomous snakes as a hobby; my collection includes adders, vipers and cobras. I spend hours studying and looking after them. I have often decided to quit, and a few weeks later I find myself getting new snakes just because they are pretty or […]
By Jingwei Li, Researcher, Autochartist.com Some brokers simply take the position of “take on as much risk as possible and therefore maximize profitability”, while others assume a more moderate approach of balancing the liquidity of their company with profitability. In this short article we investigate the use of a sentiment-based indicator to assist brokers in […]

Autochartist is proud to announce that it has concluded the acquisition of a controlling stake in Delkos Research (www.delkos.com) – a company providing forecasts and content for Futures and Forex brokers based around macro-economic news events. This is the second acquisition that Autochartist has concluded in 2018. Delkos’s News Events Trading Services (NETS) allows traders to […]