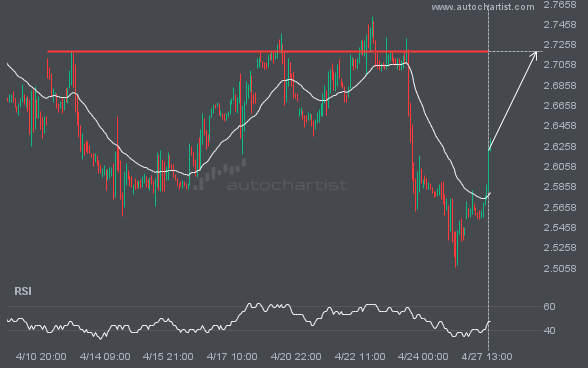
NGC/USD is moving toward a resistance line. Because it has retraced from this level in the past, we may see either a breakout through this line or a rebound to current levels. It has touched this line multiple times over the last 15 days and may test it again within the next 3 days.
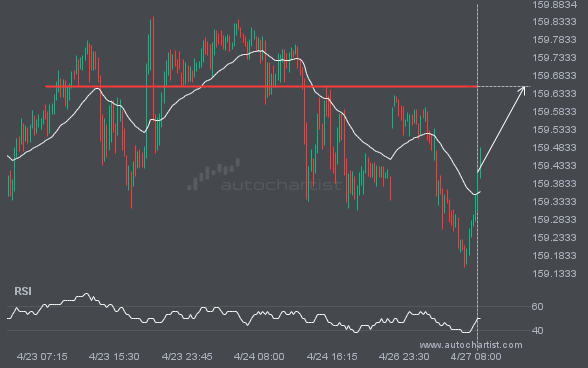
USDJPY is moving toward a resistance line. Because it has retraced from this level in the past, we may see either a breakout through this line or a rebound to current levels. It has touched this line multiple times over the last 5 days and may test it again within the next 12 hours.
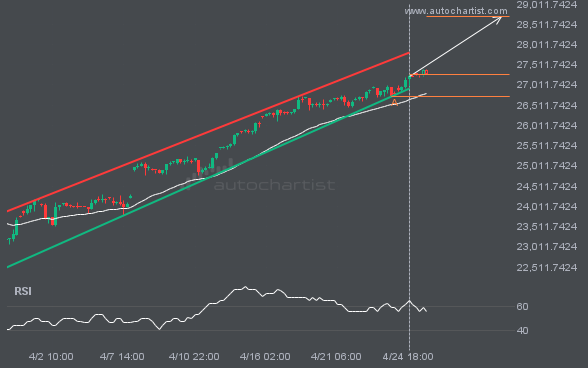
An emerging Channel Up pattern in its final wave has been identified on the NAS100 4 hour chart. After a strong bullish run, NAS100 is heading toward the upper triangle trendline, with possible resistance at 28701.8878. If the resistance holds, the Channel Up pattern suggests a rebound toward current levels.
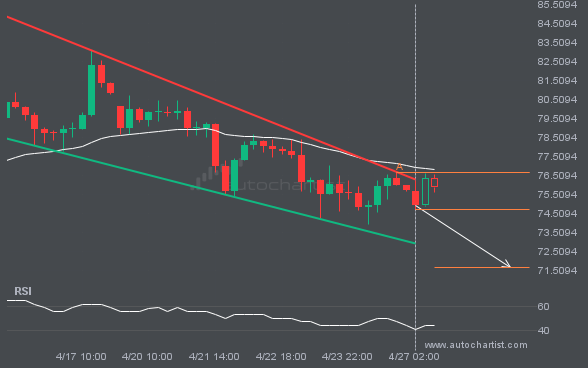
An emerging Falling Wedge pattern in its final wave has been identified on the XAGUSD 4 hour chart. After a strong bearish run, XAGUSD is heading toward the upper triangle trendline, with possible resistance at 71.6759. If the support holds, the Falling Wedge pattern suggests a rebound toward current levels.
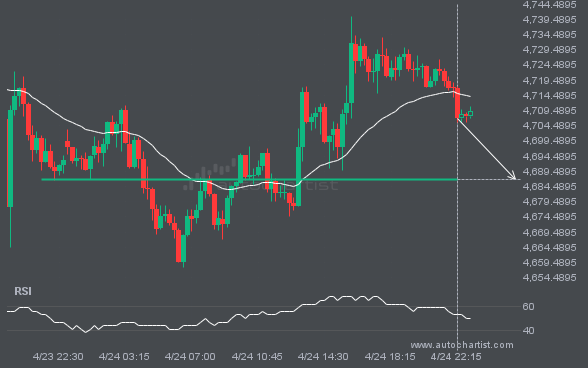
XAUUSD is approaching the line at 4686.9048. If this move continues, the price of XAUUSD could test 4686.9048 within the next 5 hours. But do not rush to trade. It has tested this line many times in the past, so the move could be short-lived and end in a rebound.
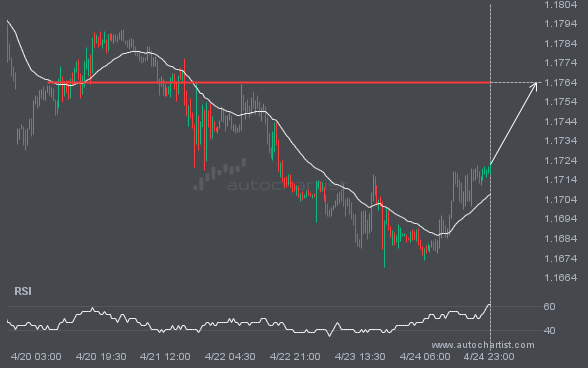
EURUSD is moving toward a level at 1.1764, which it has tested many times before. We have seen it retrace from this level before, so at this stage it isn’t clear whether it will break through this price or rebound again. If EURUSD continues on its current trajectory, we may see it move toward 1.1764 […]
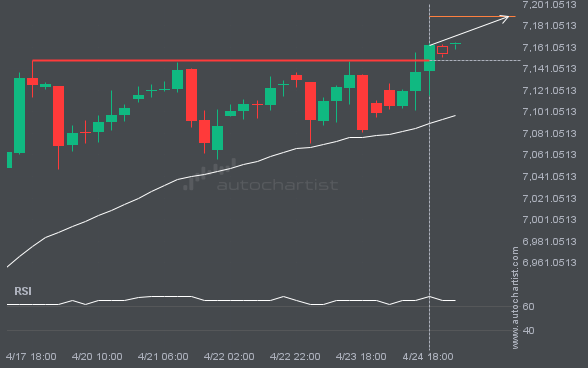
The price of S&P500 is heading toward 7189.4180. Despite the recent breakout through 7148.6401, it may struggle to gain momentum to reach the forecast price and could move back in the other direction. This has happened many times in the past, so watch for a possible bounce back.
By Ilan Azbel, with the help of Jingwei Li.I have encountered a number of stock, currency and futures broker websites
llan Azbel, CEO and Founder of Autochartist, has over 20 years experience in technology, 15 years in the financial markets and an academic background in mathematics, computer-science and engineering. Hi Ilan, thank you for joining us today. With Amazon, Tesla and Apple blowing-up the media daily, everybody would love the opportunity to purchase Stocks and I […]
Developing a proprietary trading platform can be an expensive and exhausting investment. However, we are seeing that brokers who choose this path are reaping the rewards. As the industry matures, so do the technological service providers. As a result, we see an upward trend in brokers building their own platforms or starting the process of […]
Ilan Azbel, CEO and Founder of Autochartist, has over 20 years of experience in technology, 15 years in the financial markets and an academic background in mathematics, computer science and engineering. Hi Ilan, thank you for joining us today. It has been over a year now since you officially launched your ‘Automated Social Media’ product. […]
There has been a lot written about the recent massive influx of retail traders in the financial markets. However, what hasn’t been discussed is the rise in the number of brokers operating in the space. This has created an intensely competitive and noisy space, where standing out in the crowd can be a herculean task. […]
By Hein van Eeden, Senior Dev @ Autochartist.com.In the beginning of 2010’s Autochartist decided to integrate our Technical Analysis Chart Patterns into MetaTrader 4 (and a little later into MetaTrader 5). This was in the form of indicators, one for each product Autochartist was offering at the time, using DLLs to communicate with our services […]
By Tamryn Hayne, Before migrating to Salesforce, we worked with various record keeping applications that just didn’t cut it for us. When you have many clients to store information for and in order to keep up with your business development productivity targets, you need to have a CRM that will do exactly what you need […]

