Skip to content
 The breakout of NAS100 through the 24699.4395 price line is a breach of an important psychological price level that it has tested numerous times in the past. If this breakout persists, NAS100 could test 24409.5957 within the next 2 days. One should always be cautious before placing a trade and wait for confirmation of the […]
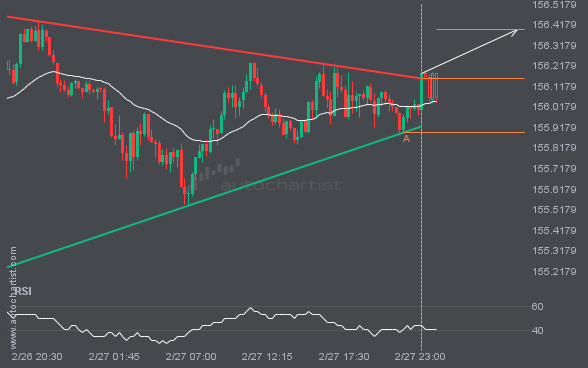
USDJPY has broken through a resistance line of the Triangle chart pattern. If this breakout holds, we may see the price of USDJPY test 156.3917 within the next 7 hours. But don’t rush to trade. It has tested this line before, so confirm the breakout before taking any action.
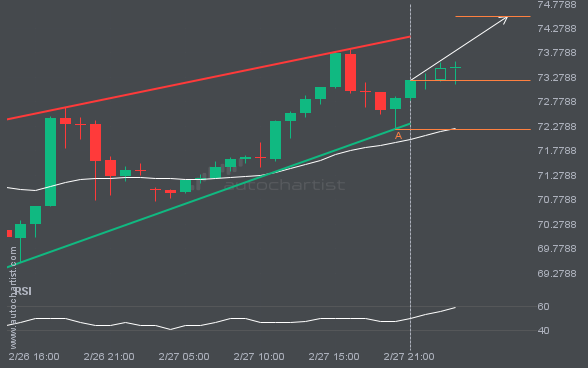
BRN/USD is moving toward a resistance line. Since it has retraced from this line before, we may see either a breakout through it or a rebound to current levels. It has touched this line multiple times in the past 2 days and may test it again within the next 5 hours.
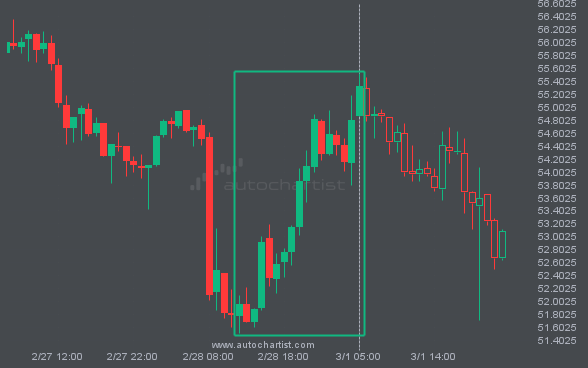
BRN/USD is trapped in a Rising Wedge formation, implying that a breakout is imminent. This is a strong trade setup for both trend and swing traders. It is now approaching a support line that has been tested before. Divergence watchers may be optimistic about a potential breakout, which could mark the start of a new […]
BAZIL DE BRUYN, GLOBAL HEAD OF PRODUCT AT AUTOCHARTIST Q1. We understand Autochartist has created some new exciting partnerships in
Since the SNB Black Swan Event of 2015, many brokers have changed their own risk management approach, moving to either a B- or C-book method. Unfortunately for traders, this approach hinges on trader failure for broker success. As a result, many brokers neglect trader risk management, preferring to take one-off profits over helping traders grow […]
It has been a tough few years for the capital markets. Covid-19 led to mass unemployment, reduced economic activities, surges in inflation, supply-chain crises, and uncertainty surrounding policy to name a few. The result has been intermittent and unpredictable bouts of high volatility in the financial markets. In 2020, record trading volumes and persistently high […]
As we commence 2022 we reflect on the year we leave behind and look forward to the possibilities of the year ahead. To get a better understanding of the events that shaped 2021 we spoke to CEO and Industry expert Ilan Azbel. We revisit what some might describe as an uncertain, yet interesting year and […]
There’s a rather embarrassing story of Hillary Clinton giving the Russian Foreign Minister a gift that represented a “resetting” of the relationship between the US and Russia. However, the translation of “reset” in Russian became “overcharge” leaving Clinton in an embarrassing situation. While not all translation errors have as extensive consequences as Clinton’s faux pas, […]
It’s a brave new world, where traders don’t hesitate to shift brokers in search of better trading experiences. How do you keep your clients engaged against such a backdrop? Traditionally, brokers have offered trading signals to enhance the trading experience, allow for informed decision making and earn trader loyalty. The problem is that today, almost […]
Take advantage of the opportunities and make sure that your clients know about them first. It’s been almost two years since the pandemic entered our lives and changed the way we live and work. During this period we have had our ups and downs but the light is now finally visible at the end of […]