Daily Top Trade Setups: Advanced Forex, Indices, Commodities, and Stock Analysis
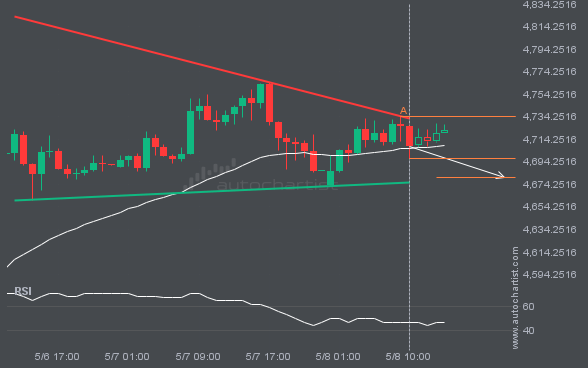
XAUUSD is approaching the support line of a Triangle pattern. We anticipate either a breakout through this line or a rebound.
An emerging Triangle pattern in its final wave has been identified on the XAUUSD 1 hour chart. After a strong bearish run, XAUUSD is heading toward the upper triangle trendline, with possible resistance at 4680.1062. If the support holds, the Triangle pattern suggests a rebound toward current levels.
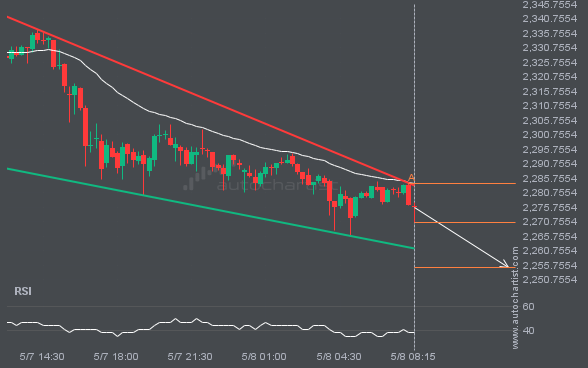
ETHUSD is approaching a support line of a Falling Wedge. It has touched this line numerous times in the last 19 hours.
A Falling Wedge pattern was identified for ETHUSD at 2270.46, suggesting it may move toward the support line at 2255.0476. It may break through that line and continue the bearish trend, or reverse from it.
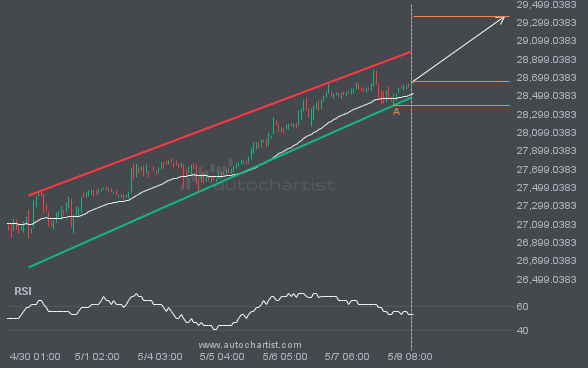
Consider a move on NAS100 as it heads toward resistance.
NAS100 is heading toward the resistance line in a Channel Up pattern. If this move continues, the price of NAS100 could test 29362.2249 within the next 3 days. It has tested this line many times before, so the move could be short-lived and may rebound as it has before.
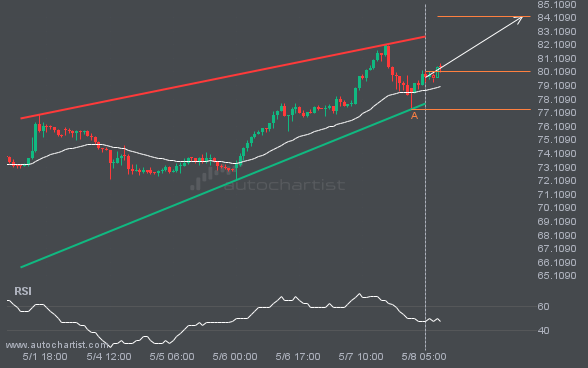
XAGUSD is signaling a possible trend reversal on intraday charts, as the price fails to breach support.
XAGUSD is moving toward a resistance line. Since it has retraced from this line before, we may see either a breakout through this line or a rebound to current levels. It has touched this line numerous times in the last 7 days and may test it again within the next 2 days.
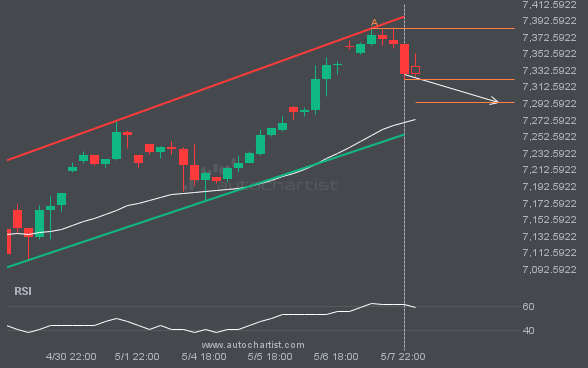
S&P500 is approaching the support line of a Channel Up pattern. We anticipate either a breakout through this line or a rebound.
S&P500 is moving toward a support line. Since it has retraced from this line before, we may see either a breakout through this line or a rebound to current levels. It has touched this line numerous times in the last 9 days and may test it again within the next 2 days.
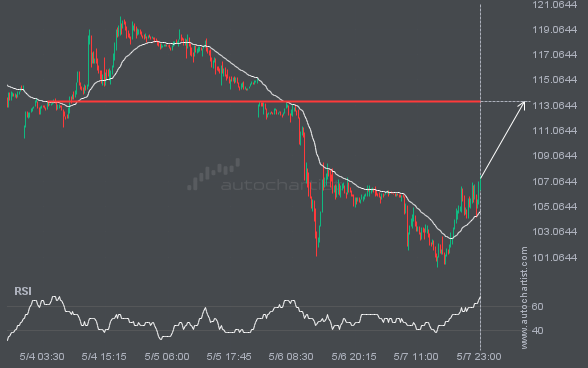
BRN/USD is heading toward a price it has tested 3 times recently.
A strong resistance level has been identified at 113.3880 on the 15 Minutes BRN/USD chart. BRN/USD is likely to test this level soon.
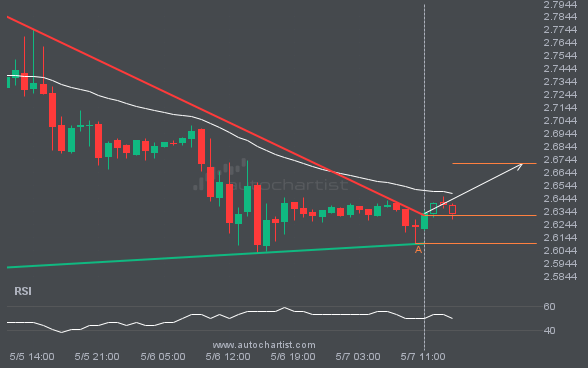
Resistance line has been breached by NGC/USD. This price level has been tested at least twice before.
The last 3 1 hour candles on NGC/USD have formed a Triangle pattern and broken out through the pattern lines, indicating a possible bullish movement toward the price level at 2.6716.
Latest company news, corporate actions and partnership announcements
Autochartist, a world-renowned technology partner that provides real-time financial market analysis, has been recognized as the “Most Comprehensive Market Analysis Provider” by
Autochartist and Swissquote have recently embarked on an impressive collaboration in which Autochartist’s Advanced Technical Analysis has been deeply integrated into their proprietary trading platform, “Advanced Trader”. This integration creates an intuitive experience for their extensive client base of global CFD traders. One of the standout features of this integration is the ability to execute […]
Today we spotlight a new Autochartist code library developed exclusively for brokers. This product creates a synergistic relationship between Autochartist, TradingView charts, and Broker platforms. Autochartist is a global leader in technical analysis for financial markets, and through its partnership with brokers around the world, it serves millions of traders in over 100 countries by providing analysis […]
I’m excited to have the opportunity to speak with you today about your experience as the head of customer training at Autochartist. To begin, can you tell me about your experience working at Autochartist? What has been the most rewarding aspect of your role, and what have been some of the biggest challenges you’ve faced? […]
Global Trade Capital Limited (GTCFX) – a leading online brokerage house, has announced its implementation of cutting-edge data analytics solutions from Autochartist, a trusted leader in automated financial market analysis. GTCFX has chosen Autochartist for its trusted reputation in the fintech brokerage industry. The partnership will allow GTCFX to offer award-winning decision-making tools to their […]
Autochartist, a world-renowned technology partner that provides real-time market analysis for traders, was named “Most Comprehensive Market Analysis Provider – Global” by the ForexRating.com Awards 2022. This award specifically highlights excellence in investment analytics solutions for financial markets and recognizes vendors providing exceptional and innovative infrastructure, technology, and data solutions. Autochartist provides a broad range […]
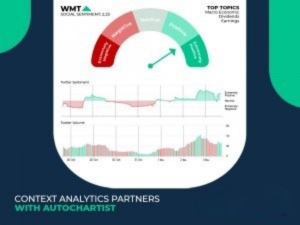
Context Analytics (CA), a global leader in Unstructured Financial Data processing has partnered with Autochartist to distribute its social media sentiment analysis tool into Europe, the United Kingdom, and APAC. Context Analytics (CA), a global leader in Unstructured Financial Data processing has partnered with Autochartist to distribute its social media sentiment analysis tool into Europe, the United […]
llan Azbel, CEO and Founder of Autochartist, has over 20 years experience in technology, 15 years in the financial markets and an academic background in mathematics, computer-science and engineering. Hi Ilan, thank you for joining us today. With Amazon, Tesla and Apple blowing-up the media daily, everybody would love the opportunity to purchase Stocks and I […]
Developing a proprietary trading platform can be an expensive and exhausting investment. However, we are seeing that brokers who choose this path are reaping the rewards. As the industry matures, so do the technological service providers. As a result, we see an upward trend in brokers building their own platforms or starting the process of […]
Ilan Azbel, CEO and Founder of Autochartist, has over 20 years of experience in technology, 15 years in the financial markets and an academic background in mathematics, computer science and engineering. Hi Ilan, thank you for joining us today. It has been over a year now since you officially launched your ‘Automated Social Media’ product. […]
There has been a lot written about the recent massive influx of retail traders in the financial markets. However, what hasn’t been discussed is the rise in the number of brokers operating in the space. This has created an intensely competitive and noisy space, where standing out in the crowd can be a herculean task. […]
By Hein van Eeden, Senior Dev @ Autochartist.com.In the beginning of 2010’s Autochartist decided to integrate our Technical Analysis Chart Patterns into MetaTrader 4 (and a little later into MetaTrader 5). This was in the form of indicators, one for each product Autochartist was offering at the time, using DLLs to communicate with our services […]
By Tamryn Hayne, Before migrating to Salesforce, we worked with various record keeping applications that just didn’t cut it for us. When you have many clients to store information for and in order to keep up with your business development productivity targets, you need to have a CRM that will do exactly what you need […]