Daily Top Trade Setups: Advanced Forex, Indices, Commodities, and Stock Analysis
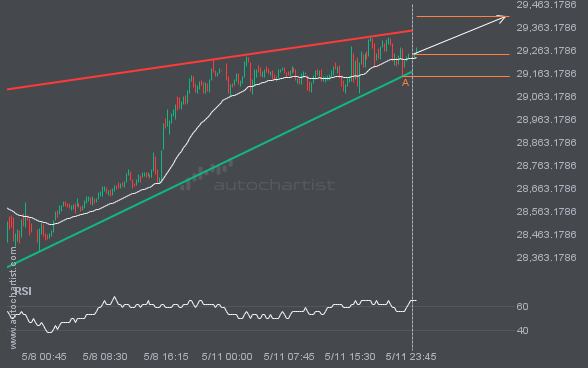
An important resistance line is being approached by NAS100. This price has been tested numerous times in the last 5 days
NAS100 is moving toward a resistance line. Since it has retraced from this line before, we may see either a breakout through this line or a rebound to current levels. It has touched this line numerous times in the last 5 days and may test it again within the next 15 hours.
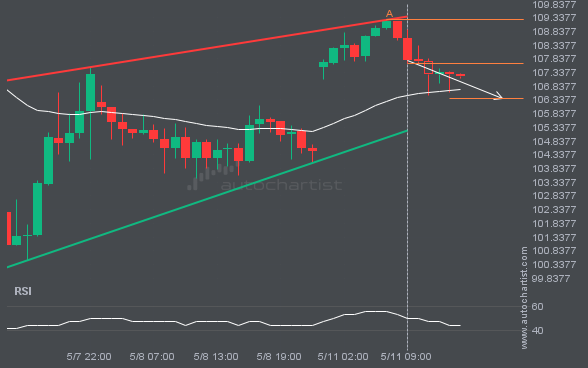
BRN/USD is approaching a support line of a Rising Wedge. It has touched this line numerous times in the last 5 days.
BRN/USD is moving toward a support line. Since it has retraced from this line before, we may see either a breakout through this line or a rebound to current levels. It has touched this line numerous times in the last 5 days and may test it again within the next 7 hours.
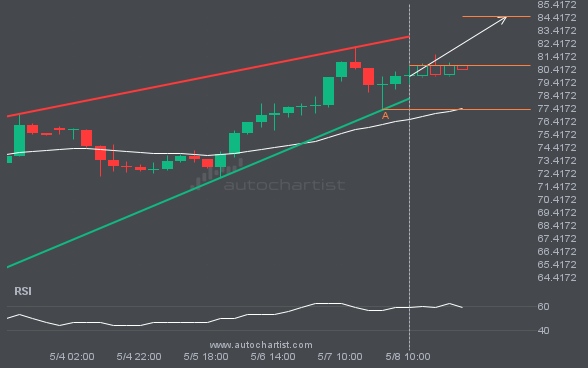
A Rising Wedge has formed, and XAGUSD is approaching support. Should we expect a breakout and the start of a new trend, or a reversal?
The movement of XAGUSD toward the resistance line of a Rising Wedge is yet another test of the line it has reached numerous times in the past. This test of the line could occur within the next 22 hours, but it is uncertain whether it will result in a breakout through this line or simply […]
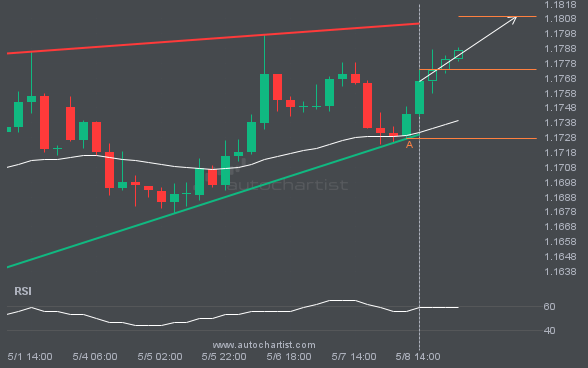
Consider a move on EURUSD as it heads toward resistance.
An emerging Rising Wedge has been detected on EURUSD. The pattern has not yet broken through support, but the price is expected to move up over the next few hours. At the time the pattern was found, the price was 1.17736, and it is expected to move to 1.1809.
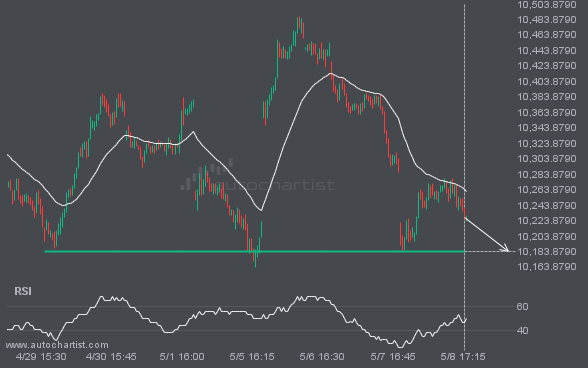
FTSE100 appears to be approaching support—a potential opportunity?
FTSE100 is about to retest a key horizontal support level near 10184.4102. It has tested this level 3 times recently and may simply bounce off it, as it did last time. However, after so many attempts, it may be ready to start a new trend.
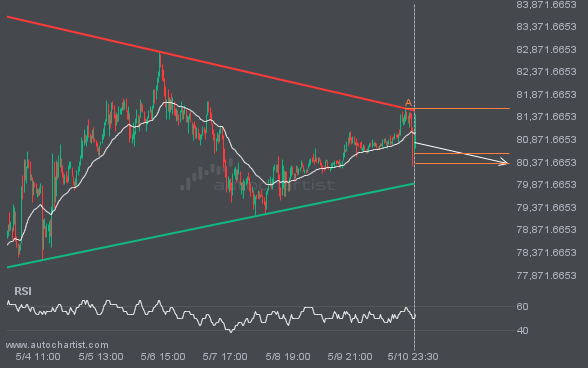
Consider a move on BTCUSD as it heads toward support.
A Triangle pattern was identified for BTCUSD at 80571.96, suggesting it may move toward the support line at 80334.0450. It may break through that line and continue the bearish trend, or reverse from it.
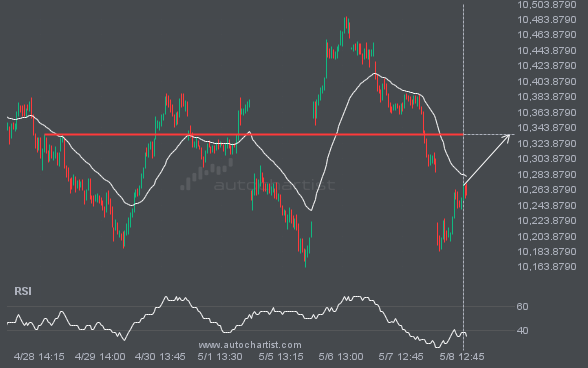
FTSE100 is heading toward a price it has tested 4 times recently.
FTSE100 is approaching a resistance line at 10335.1396. If it hits the resistance line, it may break through this level to continue the bullish trend, or it may return to current levels.
Latest company news, corporate actions and partnership announcements
Autochartist, a world-renowned technology partner that provides real-time financial market analysis, has been recognized as the “Most Comprehensive Market Analysis Provider” by
Autochartist and Swissquote have recently embarked on an impressive collaboration in which Autochartist’s Advanced Technical Analysis has been deeply integrated into their proprietary trading platform, “Advanced Trader”. This integration creates an intuitive experience for their extensive client base of global CFD traders. One of the standout features of this integration is the ability to execute […]
Today we spotlight a new Autochartist code library developed exclusively for brokers. This product creates a synergistic relationship between Autochartist, TradingView charts, and Broker platforms. Autochartist is a global leader in technical analysis for financial markets, and through its partnership with brokers around the world, it serves millions of traders in over 100 countries by providing analysis […]
I’m excited to have the opportunity to speak with you today about your experience as the head of customer training at Autochartist. To begin, can you tell me about your experience working at Autochartist? What has been the most rewarding aspect of your role, and what have been some of the biggest challenges you’ve faced? […]
Global Trade Capital Limited (GTCFX) – a leading online brokerage house, has announced its implementation of cutting-edge data analytics solutions from Autochartist, a trusted leader in automated financial market analysis. GTCFX has chosen Autochartist for its trusted reputation in the fintech brokerage industry. The partnership will allow GTCFX to offer award-winning decision-making tools to their […]
Autochartist, a world-renowned technology partner that provides real-time market analysis for traders, was named “Most Comprehensive Market Analysis Provider – Global” by the ForexRating.com Awards 2022. This award specifically highlights excellence in investment analytics solutions for financial markets and recognizes vendors providing exceptional and innovative infrastructure, technology, and data solutions. Autochartist provides a broad range […]
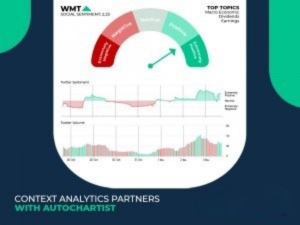
Context Analytics (CA), a global leader in Unstructured Financial Data processing has partnered with Autochartist to distribute its social media sentiment analysis tool into Europe, the United Kingdom, and APAC. Context Analytics (CA), a global leader in Unstructured Financial Data processing has partnered with Autochartist to distribute its social media sentiment analysis tool into Europe, the United […]
Since the SNB Black Swan Event of 2015, many brokers have changed their own risk management approach, moving to either a B- or C-book method. Unfortunately for traders, this approach hinges on trader failure for broker success. As a result, many brokers neglect trader risk management, preferring to take one-off profits over helping traders grow […]
It has been a tough few years for the capital markets. Covid-19 led to mass unemployment, reduced economic activities, surges in inflation, supply-chain crises, and uncertainty surrounding policy to name a few. The result has been intermittent and unpredictable bouts of high volatility in the financial markets. In 2020, record trading volumes and persistently high […]
As we commence 2022 we reflect on the year we leave behind and look forward to the possibilities of the year ahead. To get a better understanding of the events that shaped 2021 we spoke to CEO and Industry expert Ilan Azbel. We revisit what some might describe as an uncertain, yet interesting year and […]
There’s a rather embarrassing story of Hillary Clinton giving the Russian Foreign Minister a gift that represented a “resetting” of the relationship between the US and Russia. However, the translation of “reset” in Russian became “overcharge” leaving Clinton in an embarrassing situation. While not all translation errors have as extensive consequences as Clinton’s faux pas, […]
It’s a brave new world, where traders don’t hesitate to shift brokers in search of better trading experiences. How do you keep your clients engaged against such a backdrop? Traditionally, brokers have offered trading signals to enhance the trading experience, allow for informed decision making and earn trader loyalty. The problem is that today, almost […]
Take advantage of the opportunities and make sure that your clients know about them first. It’s been almost two years since the pandemic entered our lives and changed the way we live and work. During this period we have had our ups and downs but the light is now finally visible at the end of […]