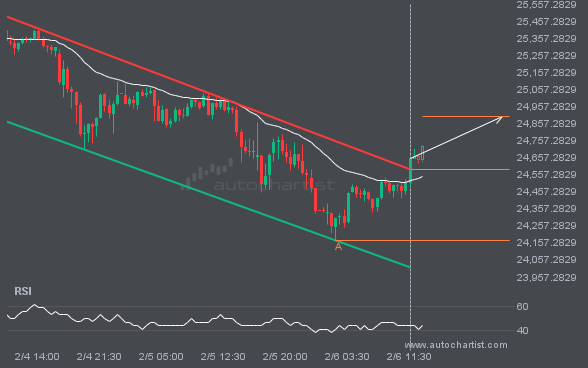
NAS100 has broken through the resistance line of a Channel Down pattern and suggests a possible move to 24898.8753 within the next 13 hours. It has tested this line before, so it is prudent to wait for confirmation of the breakout before taking action. If the breakout is not confirmed, we could see a retracement […]

BRN/USD is moving toward a resistance line. Since it has retraced from this line before, we may see either a breakout through it or a rebound to current levels. It has touched this line multiple times in the past 8 days and may test it again within the next 2 days.
XAUUSD is trapped in a Channel Down formation, implying that a breakout is imminent. This is a strong trade setup for both trend and swing traders. It is now approaching a resistance line that has been tested before. Divergence watchers may be optimistic about a potential breakout, which could mark the start of a new […]
GBPJPY has broken through the support line of a Triangle technical chart pattern. Because it has retraced from this line in the past, you should wait for confirmation of the breakout before taking any action. It has touched this line twice in the last 4 days, which suggests a possible target around 212.9373 within the […]
NGC/USD has moved through the support line of a Triangle pattern at 4.415026315789474 on the 1 hour chart. This line has been tested multiple times in the past, and this breakout could signal an upcoming change in the current trend. Price may continue in the current direction toward 4.3277.
Autochartist, a world-renowned technology partner that provides real-time financial market analysis, has been recognized as the “Most Comprehensive Market Analysis Provider” by
Autochartist and Swissquote have recently embarked on an impressive collaboration in which Autochartist’s Advanced Technical Analysis has been deeply integrated into their proprietary trading platform, “Advanced Trader”. This integration creates an intuitive experience for their extensive client base of global CFD traders. One of the standout features of this integration is the ability to execute […]
Today we spotlight a new Autochartist code library developed exclusively for brokers. This product creates a synergistic relationship between Autochartist, TradingView charts, and Broker platforms. Autochartist is a global leader in technical analysis for financial markets, and through its partnership with brokers around the world, it serves millions of traders in over 100 countries by providing analysis […]
I’m excited to have the opportunity to speak with you today about your experience as the head of customer training at Autochartist. To begin, can you tell me about your experience working at Autochartist? What has been the most rewarding aspect of your role, and what have been some of the biggest challenges you’ve faced? […]
Global Trade Capital Limited (GTCFX) – a leading online brokerage house, has announced its implementation of cutting-edge data analytics solutions from Autochartist, a trusted leader in automated financial market analysis. GTCFX has chosen Autochartist for its trusted reputation in the fintech brokerage industry. The partnership will allow GTCFX to offer award-winning decision-making tools to their […]
Autochartist, a world-renowned technology partner that provides real-time market analysis for traders, was named “Most Comprehensive Market Analysis Provider – Global” by the ForexRating.com Awards 2022. This award specifically highlights excellence in investment analytics solutions for financial markets and recognizes vendors providing exceptional and innovative infrastructure, technology, and data solutions. Autochartist provides a broad range […]
Context Analytics (CA), a global leader in Unstructured Financial Data processing has partnered with Autochartist to distribute its social media sentiment analysis tool into Europe, the United Kingdom, and APAC. Context Analytics (CA), a global leader in Unstructured Financial Data processing has partnered with Autochartist to distribute its social media sentiment analysis tool into Europe, the United […]
Every retail broker knows this moment: A once-active trader starts slowing down. Fewer logins. No recent trades. Then…silence. One of
In the financial markets, filled with hype and fast-moving headlines, it’s easy for traders, especially newer ones, to feel like they’re constantly chasing the next big thing. But most experienced traders don’t jump from trend to trend. They stick to the basics, build on what works, and adjust when the markets shift. Let’s take a […]
There’s one thing guaranteed to move the markets fast: economic events. Whether it’s an unexpected geopolitical event, a central bank rate hike, or a tech giant’s unfavourable earnings report, traders are tuned in, waiting for the next big move. And when those economic announcements hit, decisions are made in seconds, not hours. The challenge? Most […]
There’s an old saying among traders: “Volatility is where the money is.” However, for many retail traders, especially those new to the game, navigating volatile markets is also where the fear is. Understanding market volatility and client experience is crucial. Right now, markets are anything but calm. Central bank policies are shifting rapidly. Inflation metrics […]
Have you noticed a decline in trader activity? Are your clients logging in less frequently, executing fewer trades, and hesitating to redeposit? Maintaining trader engagement is a common challenge for retail brokers worldwide. Effective Trader Engagement Strategies for Retail Brokers can help address these issues. Traders can lose momentum due to market uncertainty, significant losses, […]
Tariffs on, tariffs off! Do you understand the potential impact of tariffs on retail trading? The daily stress of navigating the ever-changing landscape of global trade policies has been intensified recently, with tariff news making headlines in all the popular financial reads. The U.S. administration’s recent tariff implementations have highlighted the need to understand […]
Most online brokers focus heavily on acquiring new traders—allocating large marketing budgets to attract new user sign-ups—but an often overlooked key to sustainable growth lies in trader longevity. A trader’s lifecycle—from when they start trading (opening their first account or making their first deposit) to when they stop trading altogether or become inactive—significantly impacts brokers […]