Skip to content
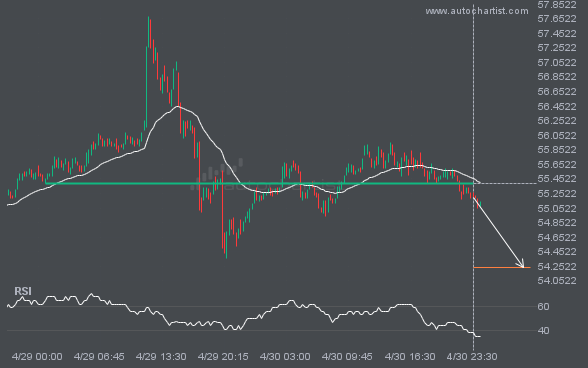
 LTCUSD is once again retesting a key horizontal support level at 55.3900. This level has been tested 6 times recently and could see another bounce, as it did last time. However, after so many attempts, it may be ready to start a new trend.
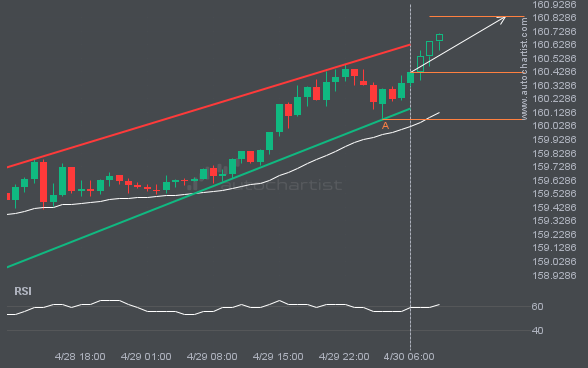
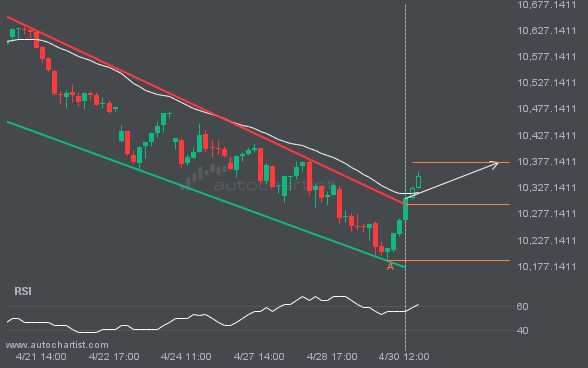
A Channel Up pattern was identified for USDJPY at 160.426, suggesting it may move toward the resistance line at 160.8360. It may break through that line and continue the bullish trend, or reverse from it.
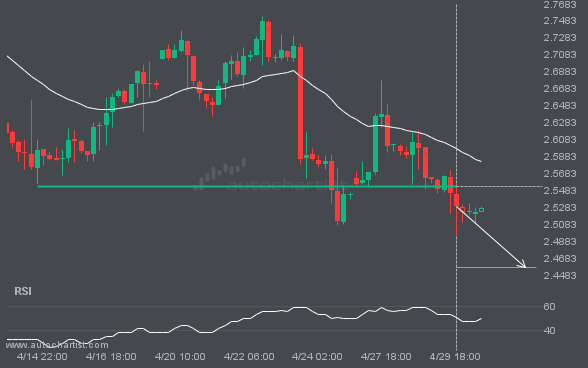
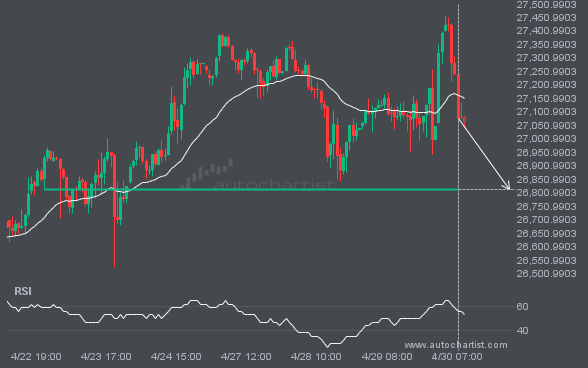
NGC/USD has broken through a level at 2.5535, suggesting a possible move to 2.4575 within the next 3 days. It has tested this level numerous times in the past, so you should wait for confirmation of this breakout before taking any action. If the breakout does not confirm, we could see a retracement back to […]
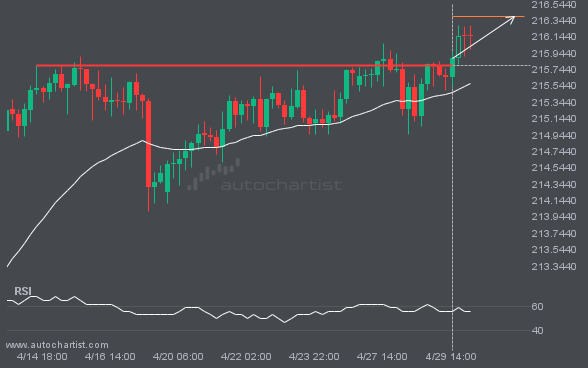
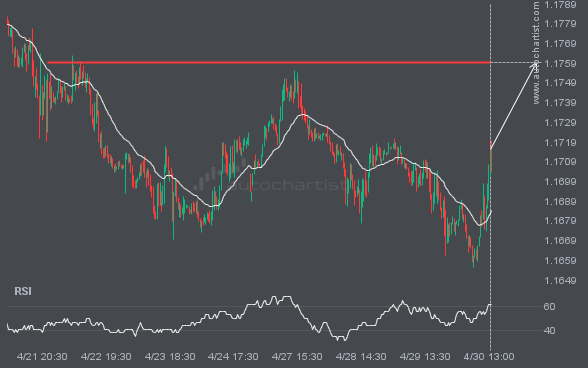
GBPJPY has broken through a resistance line. Because it has previously retraced from this price, you should wait for confirmation of the breakout before trading. It has touched this line multiple times over the past 16 days, which suggests a possible target around 216.3907 within the next 3 days.
The biggest challenge faced by brokers is client retention. About 40% of traders who register on an online platform leave

With 2022 close to an end, are you planning your marketing and client retention budget for 2023 yet? Make sure you include email marketing in your budget. Not sure if you want to tie up resources in email marketing? Here’s what you need to know. Small businesses are reaping the maximum benefits of email marketing, […]

As many as 89% of successful businesses say that providing assistive customer experiences is critical to their growth. That’s because a mere 5% increase in customer retention can boost profits by 25% to 95%. As many as 89% of successful businesses say that providing assistive customer experiences is critical to their growth. That’s because a mere […]
After a successful debut, the FinanceFeeds Podcast returns with an interview with Ilan Azbel, Founder and CEO of Autochartist, developer of the automated market analysis tools that identify market opportunities and alerts traders in real-time. Listen on SpotifyListen on Apple Podcasts, Google Podcasts and other platforms Ilan Azbel founded Autochartist in 2001 and currently focuses […]
The CBOE Volatility Index (VIX), which is considered the barometer of market volatility, spiked to an almost record high of over 65 in March 2020, in sync with the pandemic outbreak. Although the index declined through the rest of 2020 and in 2021, it surged more than 87% in the first half of 2022. VIX […]
As products eliminate geographical boundaries, the issue of multi language content becomes important. Trading platforms need to offer unambiguous and precise interfaces to users, with investment and regulatory information in local languages. The global community of market participants has seen exponential growth with the advent of online trading platforms with multi-device compatibilities. With evolving regulations […]
The online trading boom that started during the pandemic-led lockdowns is abating. This is in part due to sustained market volatility which seems to be discouraging new investors. For example, day trading volumes in the US for retail investors declined in the last 2 quarters of 2021. Brokers need to rethink their strategies to retain […]