Skip to content
 BTCUSD is moving toward a resistance line. Since it has retraced from this line before, we may see either a breakout through it or a rebound to current levels. It has touched this line multiple times in the past 8 days and may test it again within the next 2 days.
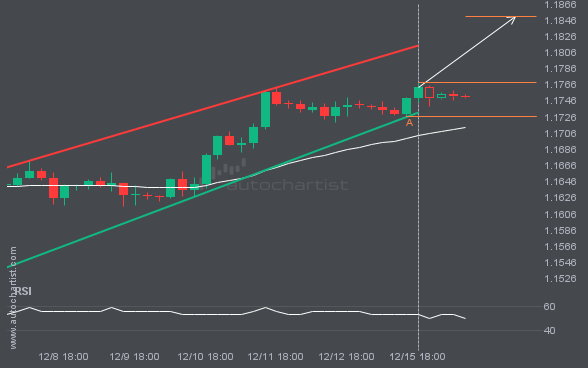
EURUSD is moving toward a resistance line it has tested many times. It has retraced from this line before, so it’s unclear whether it will break through or rebound again. If EURUSD continues on its current trajectory, it could reach 1.1850 within the next 2 days.
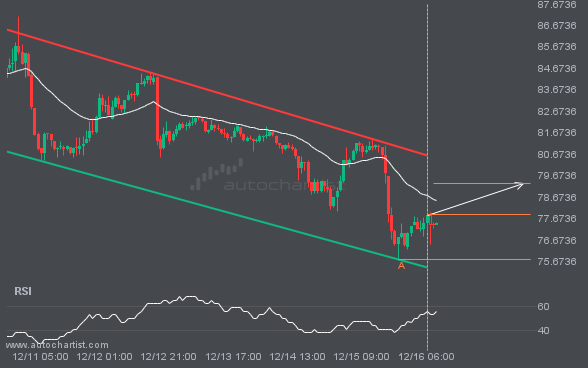
An emerging Channel Down pattern in its final wave has been identified on the LTCUSD 1 hour chart. After a strong bullish run, LTCUSD is heading toward the upper triangle trendline, with possible resistance at 79.3020. If the resistance holds, the Channel Down pattern suggests a rebound toward current levels.
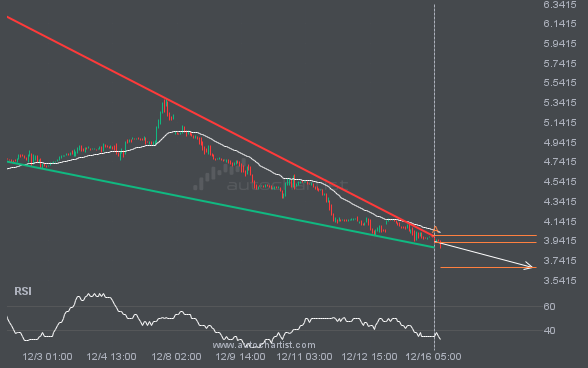
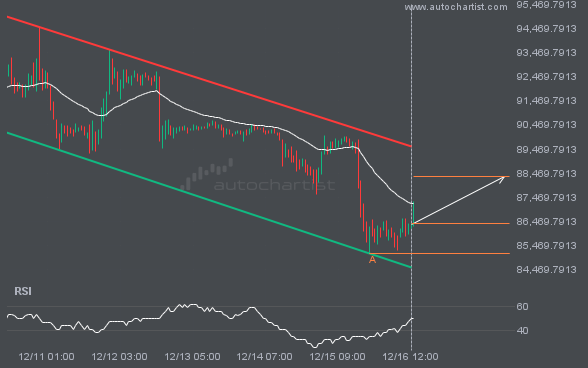
NGC/USD is moving toward a support line. Since it has retraced from this line before, we may see either a breakout through this line or a rebound to current levels. It has touched this line numerous times in the last 20 days and may test it again within the next 3 days.
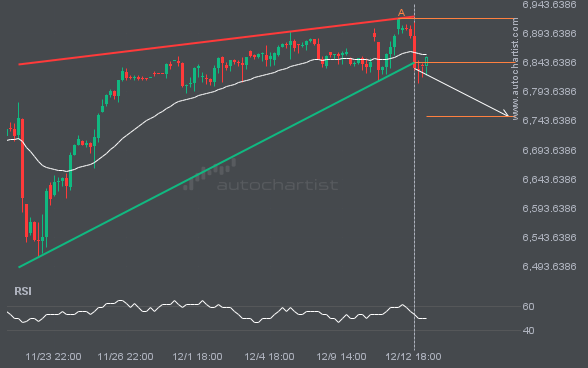
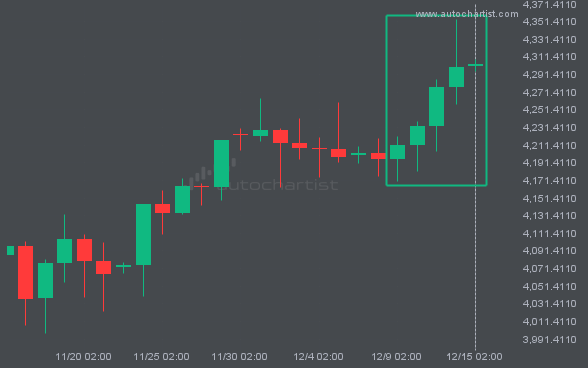
Rising Wedge pattern identified on S&P500 has broken through a support level, with price momentum continuing to move downward. This presents a solid trading opportunity, with the price expected to reach 6750.2777 in the next 3.
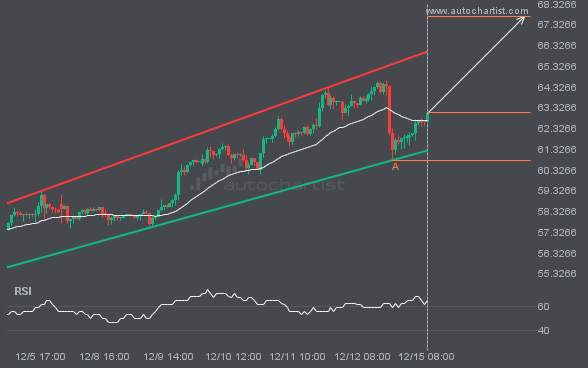
An emerging Channel Up pattern has been detected for XAGUSD on the 1 hour chart. There may be a move toward 67.7226 in the next few candles. Once it reaches the resistance, it may continue its bullish run or revert to current price levels.