 Skip to content
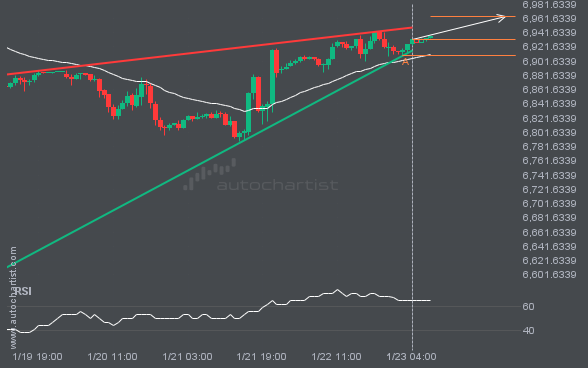
 S&P500 is moving toward a resistance line. Since it has retraced from this line before, we may see either a breakout through it or a rebound to current levels. It has touched this line multiple times in the past 4 days and may test it again within the next 21 hours.
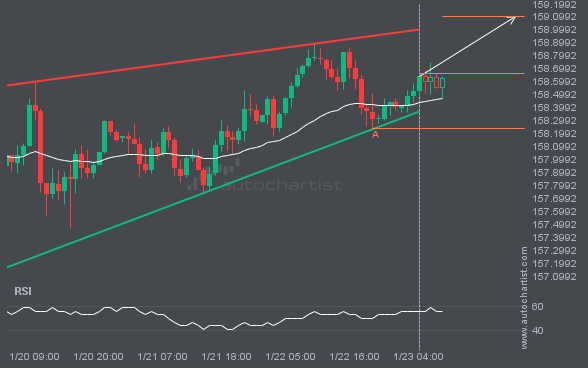
An emerging Rising Wedge pattern has been detected for USDJPY on the 1 hour chart. There may be a move toward 159.1024 in the next few candles. Once it reaches the resistance, it may continue its bullish run or revert to current price levels.
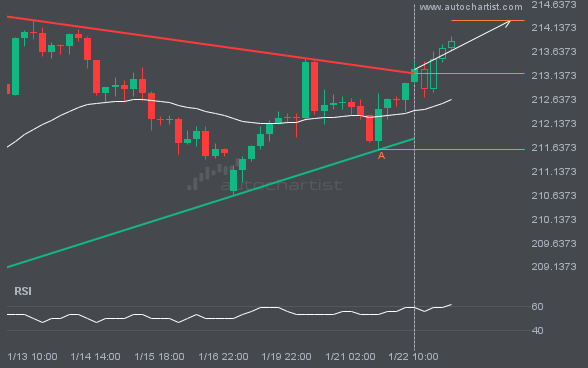
Triangle pattern identified on GBPJPY has broken through a resistance level, with price momentum continuing to move upward. This presents a solid trading opportunity, with the price expected to reach 214.2830 in the next 2.
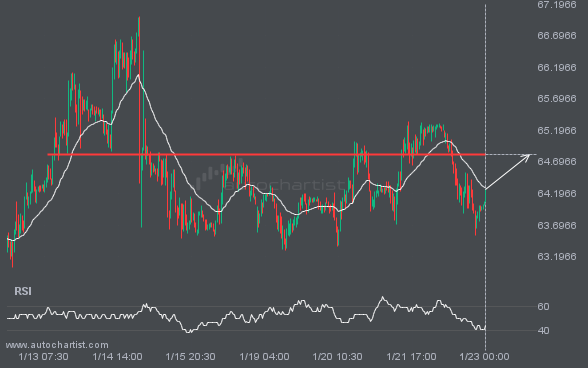
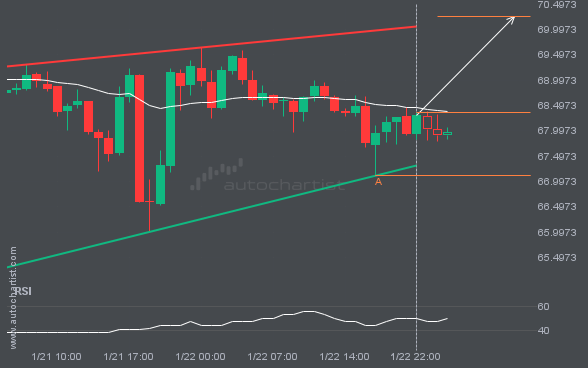
BRN/USD is approaching the line at 64.8140. If this move continues, the price of BRN/USD could test 64.8140 within the next 2 days. But do not rush to trade. It has tested this line many times in the past, so the move could be short-lived and end in a rebound.
LTCUSD is moving toward a resistance line. Since it has retraced from this line before, we may see either a breakout through it or a rebound to current levels. It has touched this line multiple times in the past 2 days and may test it again within the next 9 hours.
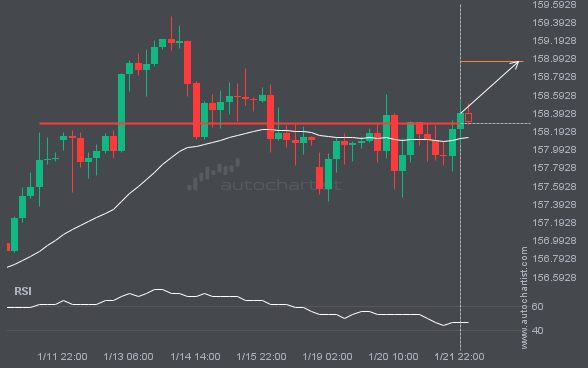
The price of USDJPY is heading toward 158.9628. Despite the recent breakout through 158.2810, it may struggle to gain momentum to reach the forecast price and could move back in the other direction. This has happened many times in the past, so watch for a possible bounce back.
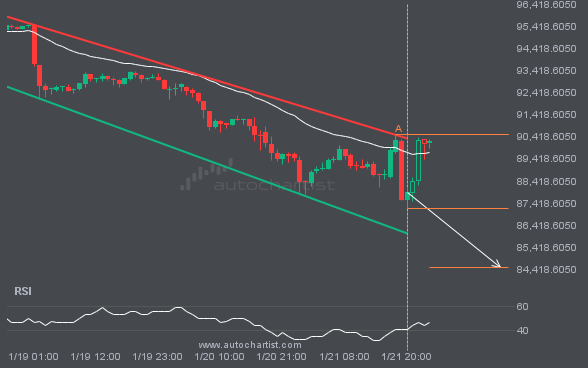
BTCUSD is moving toward a support line it has tested many times. It has retraced from this line before, so it’s unclear whether it will break through or rebound again. If BTCUSD continues on its current trajectory, it could reach 84518.4630 within the next 17 hours.

