Skip to content
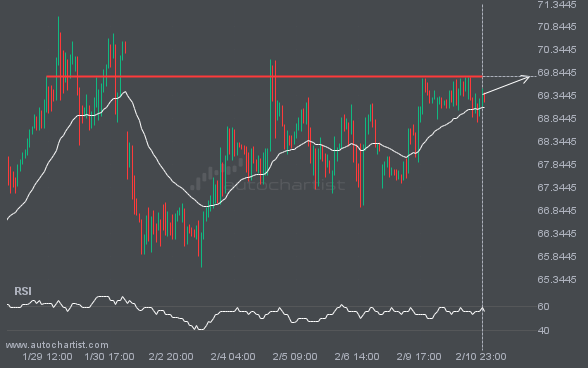
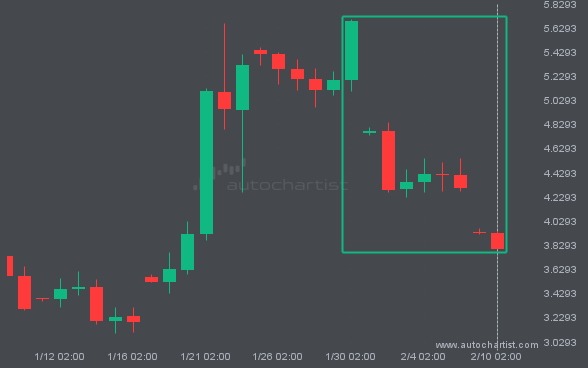
BRN/USD is approaching the line at 69.7610. If this move continues, the price of BRN/USD could test 69.7610 within the next 2 days. But do not rush to trade. It has tested this line many times in the past, so the move could be short-lived and end in a rebound.
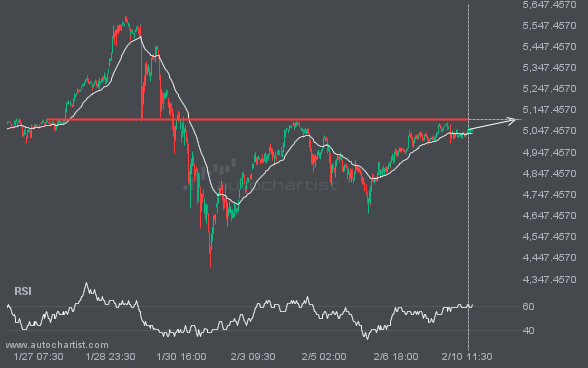
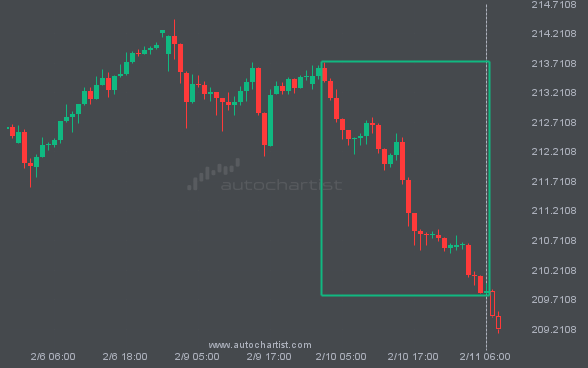
XAUUSD is moving toward a resistance line. Because it has retraced from this level in the past, we may see either a breakout through this line or a rebound to current levels. It has touched this line multiple times over the last 15 days and may test it again within the next 3 days.
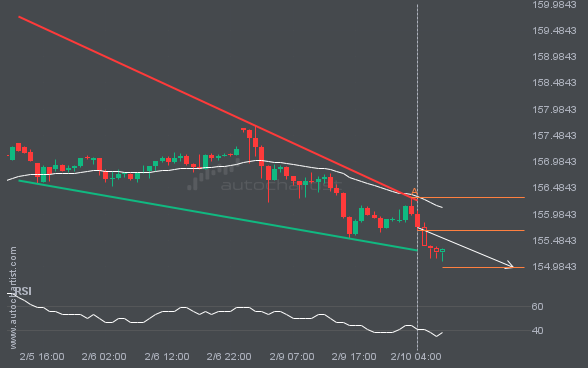
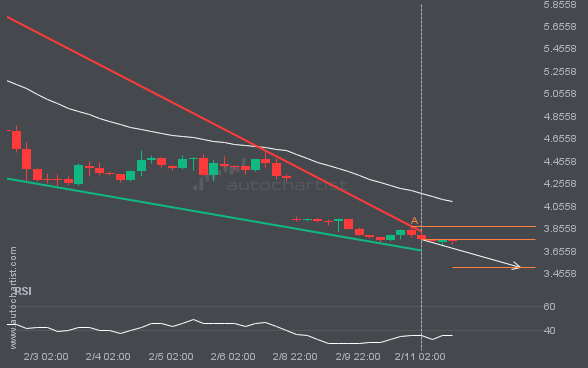
USDJPY is heading toward the support line of a Falling Wedge pattern and could reach it within the next 15 hours. It has tested this line numerous times before, and this time may be no different, ending in a rebound instead of a breakout. If a breakout doesn’t occur, we could see a retracement back […]
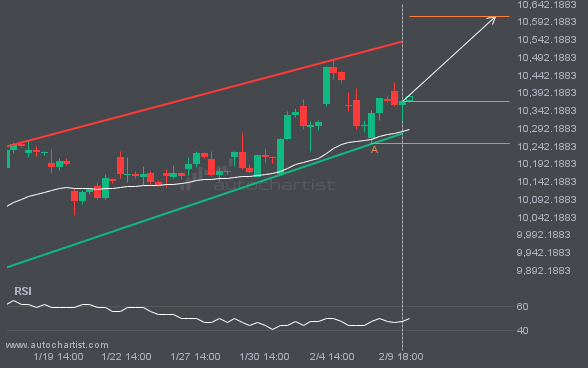
An emerging Channel Up pattern has been detected for FTSE100 on the 4 hour chart. There may be a move toward 10606.8650 in the next few candles. Once it reaches the resistance, it may continue its bullish run or revert to current price levels.