Skip to content
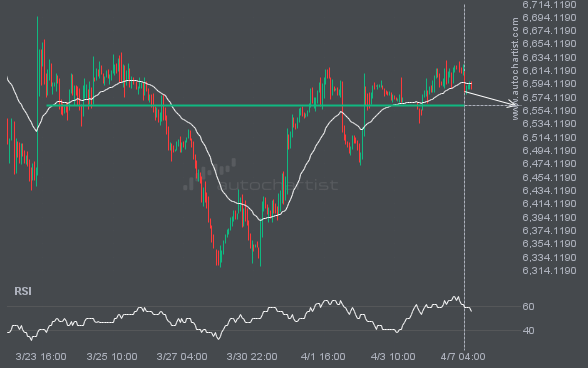
 S&P500 is moving toward a support line. Because it has retraced from this level in the past, we may see either a breakout through this line or a rebound to current levels. It has touched this line multiple times over the last 15 days and may test it again within the next 3 days.
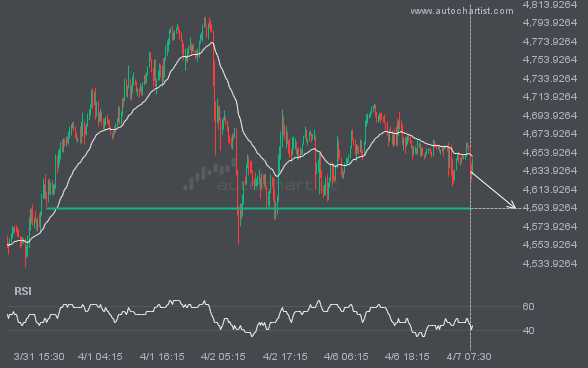
XAUUSD is approaching the line at 4592.9512. If this move continues, the price of XAUUSD could test 4592.9512 within the next 20 hours. But do not rush to trade. It has tested this line many times in the past, so the move could be short-lived and end in a rebound.
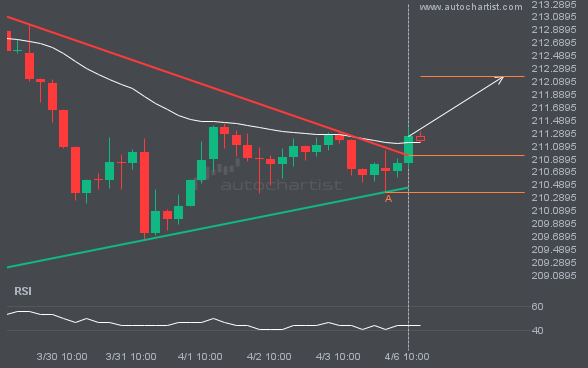
GBPJPY has broken through the resistance line, which it has tested twice before. We have seen it retrace from this line before, so wait for confirmation of the breakout before trading. If this new trend persists, a target level around 212.1622 may materialize within the next 2 days.
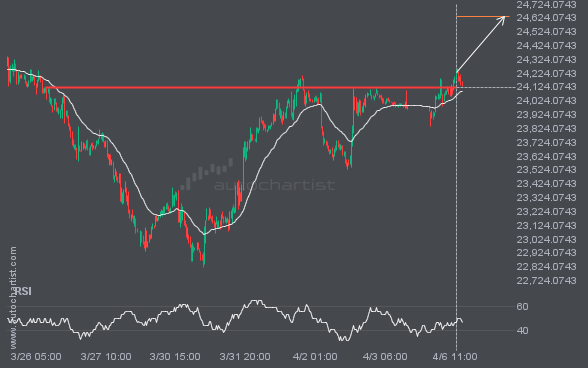
NAS100 has broken through a resistance line. Because it has previously retraced from this price, you should wait for confirmation of the breakout before trading. It has touched this line multiple times over the past 12 days, which suggests a possible target around 24633.3633 within the next 2 days.
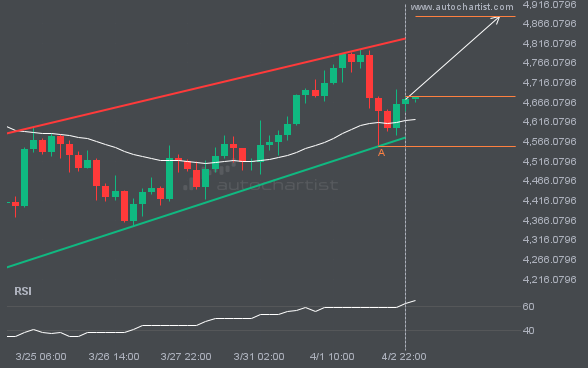
An emerging Channel Up pattern in its final wave has been identified on the XAUUSD 4 hour chart. After a strong bullish run, XAUUSD is heading toward the upper triangle trendline, with possible resistance at 4884.1774. If the resistance holds, the Channel Up pattern suggests a rebound toward current levels.
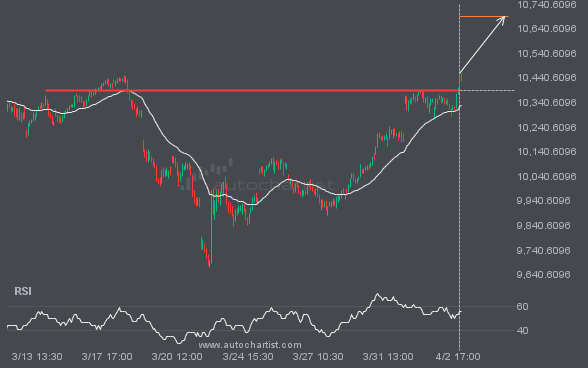
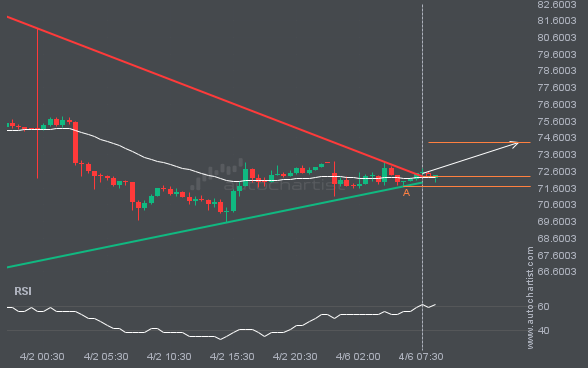
FTSE100 has broken through a resistance line. Because it has previously retraced from this price, you should wait for confirmation of the breakout before trading. It has touched this line multiple times over the past 21 days, which suggests a possible target around 10689.6367 within the next 2 days.