Skip to content
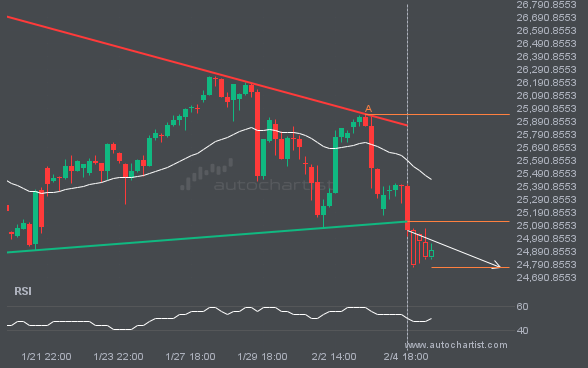
 NAS100 has broken through the support line of a Triangle pattern and suggests a possible move to 24770.9905 within the next 3 days. It has tested this line before, so it is prudent to wait for confirmation of the breakout before taking action. If the breakout is not confirmed, we could see a retracement back […]
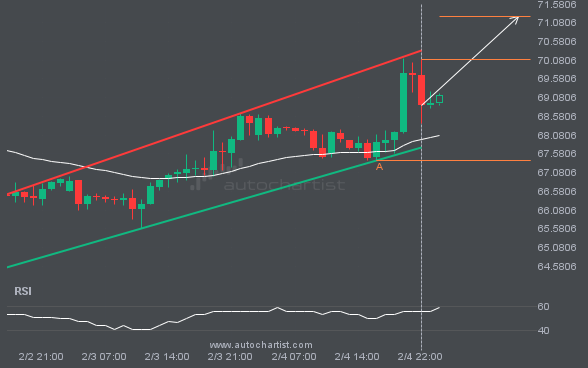
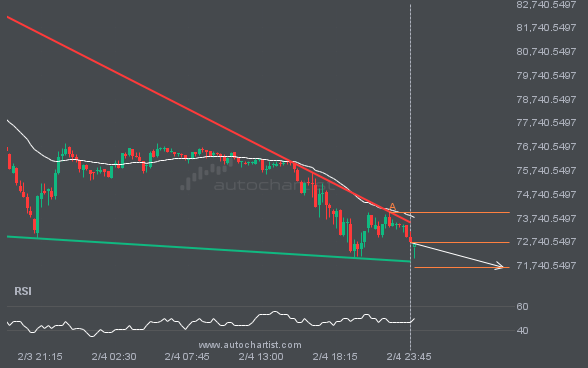
BRN/USD is moving toward a resistance line it has tested many times. It has retraced from this line before, so it’s unclear whether it will break through or rebound again. If BRN/USD continues on its current trajectory, it could reach 71.2460 within the next 12 hours.
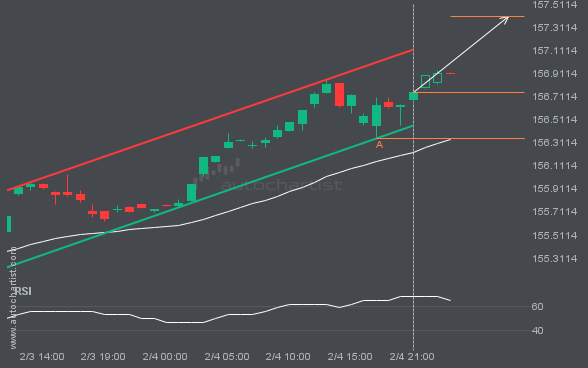
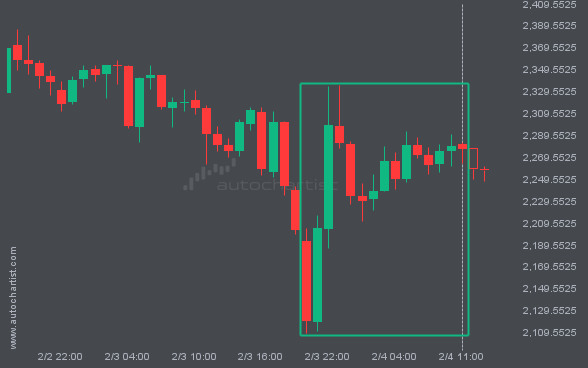
USDJPY is heading toward the resistance line of a Channel Up pattern and could reach it within the next 6 hours. It has tested this line numerous times before, and this time may be no different, ending in a rebound instead of a breakout. If a breakout doesn’t occur, we could see a retracement back […]
BTCUSD is trapped in a Falling Wedge formation, implying that a breakout is imminent. This is a strong trade setup for both trend and swing traders. It is now approaching a resistance line that has been tested before. Divergence watchers may be optimistic about a potential breakout, which could mark the start of a new […]
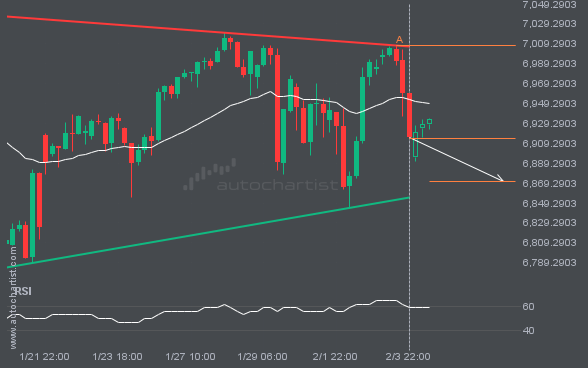
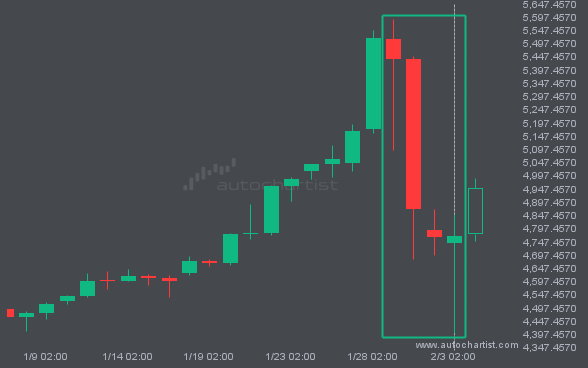
An emerging Triangle pattern in its final wave has been identified on the S&P500 4 hour chart. After a strong bearish run, S&P500 is heading toward the upper triangle trendline, with possible resistance at 6870.9042. If the support holds, the Triangle pattern suggests a rebound toward current levels.