Skip to content
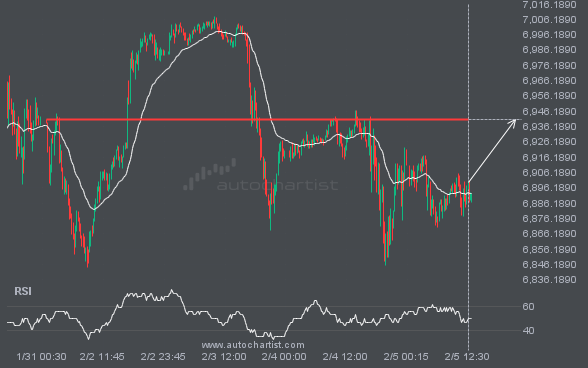
 XAUUSD is trapped in a Channel Down formation, implying that a breakout is imminent. This is a strong trade setup for both trend and swing traders. It is now approaching a resistance line that has been tested before. Divergence watchers may be optimistic about a potential breakout, which could mark the start of a new […]
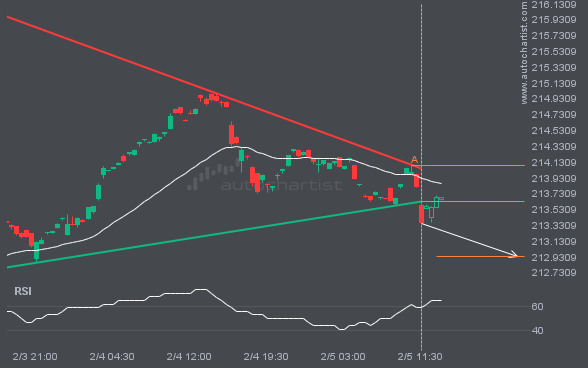
GBPJPY has broken through the support line of a Triangle technical chart pattern. Because it has retraced from this line in the past, you should wait for confirmation of the breakout before taking any action. It has touched this line twice in the last 4 days, which suggests a possible target around 212.9373 within the […]
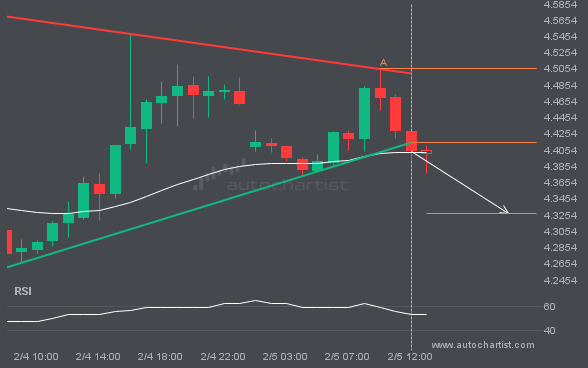
NGC/USD has moved through the support line of a Triangle pattern at 4.415026315789474 on the 1 hour chart. This line has been tested multiple times in the past, and this breakout could signal an upcoming change in the current trend. Price may continue in the current direction toward 4.3277.
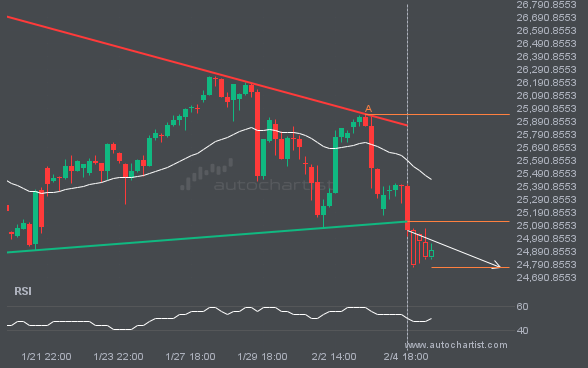
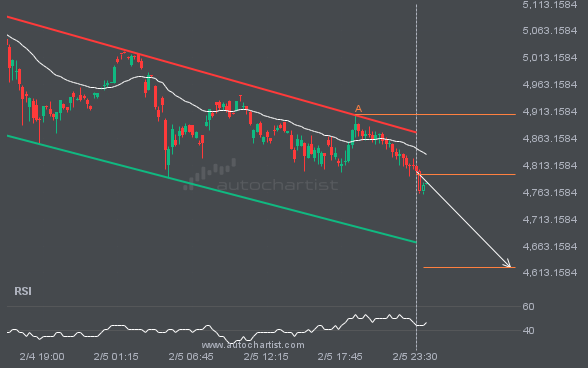
NAS100 has broken through the support line of a Triangle pattern and suggests a possible move to 24770.9905 within the next 3 days. It has tested this line before, so it is prudent to wait for confirmation of the breakout before taking action. If the breakout is not confirmed, we could see a retracement back […]
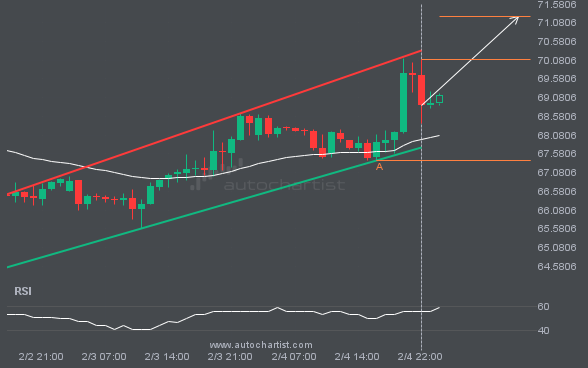
BRN/USD is moving toward a resistance line it has tested many times. It has retraced from this line before, so it’s unclear whether it will break through or rebound again. If BRN/USD continues on its current trajectory, it could reach 71.2460 within the next 12 hours.
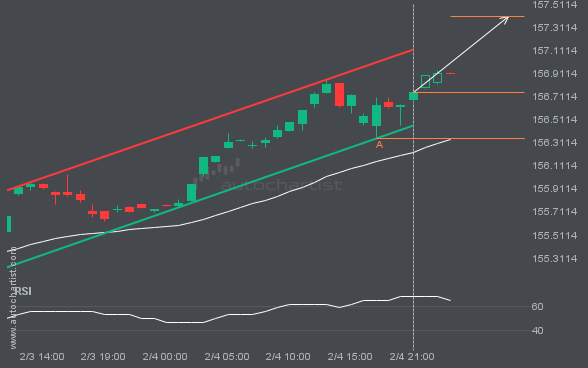
USDJPY is heading toward the resistance line of a Channel Up pattern and could reach it within the next 6 hours. It has tested this line numerous times before, and this time may be no different, ending in a rebound instead of a breakout. If a breakout doesn’t occur, we could see a retracement back […]