Skip to content
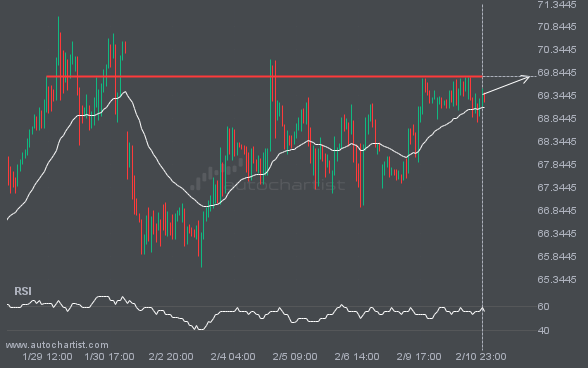
 BRN/USD is approaching the line at 69.7610. If this move continues, the price of BRN/USD could test 69.7610 within the next 2 days. But do not rush to trade. It has tested this line many times in the past, so the move could be short-lived and end in a rebound.
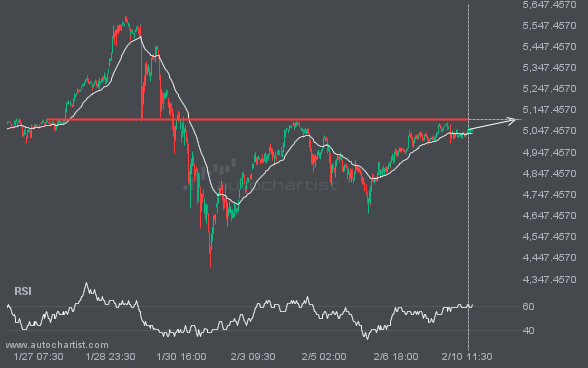
XAUUSD is moving toward a resistance line. Because it has retraced from this level in the past, we may see either a breakout through this line or a rebound to current levels. It has touched this line multiple times over the last 15 days and may test it again within the next 3 days.
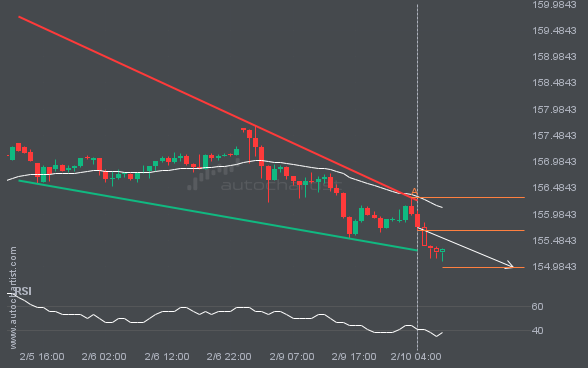
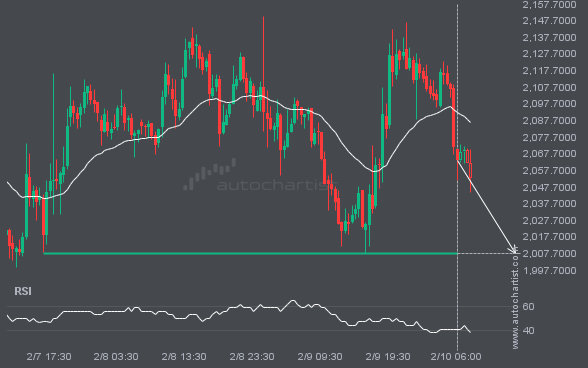
USDJPY is heading toward the support line of a Falling Wedge pattern and could reach it within the next 15 hours. It has tested this line numerous times before, and this time may be no different, ending in a rebound instead of a breakout. If a breakout doesn’t occur, we could see a retracement back […]
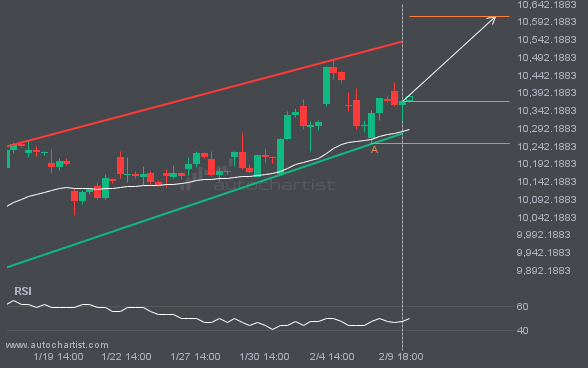
An emerging Channel Up pattern has been detected for FTSE100 on the 4 hour chart. There may be a move toward 10606.8650 in the next few candles. Once it reaches the resistance, it may continue its bullish run or revert to current price levels.
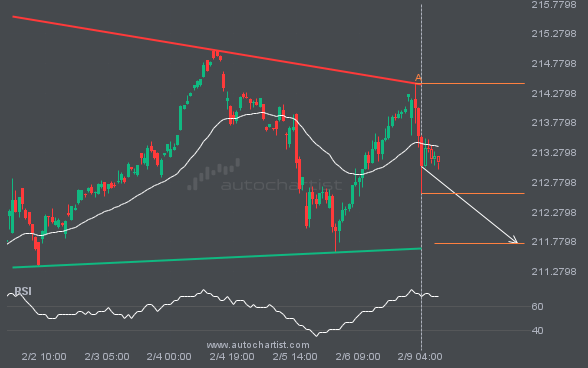
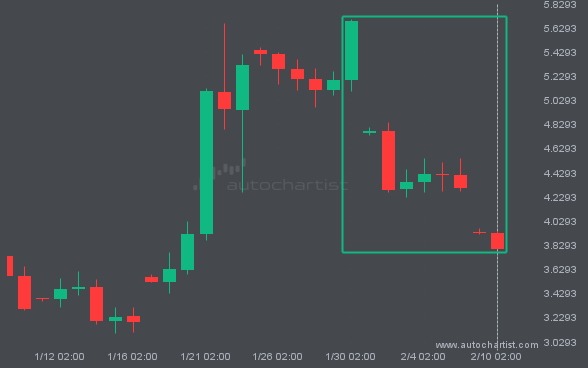
An emerging Descending Triangle pattern in its final wave has been identified on the GBPJPY 1 hour chart. After a strong bearish run, GBPJPY is heading toward the upper triangle trendline, with possible resistance at 211.7535. If the support holds, the Descending Triangle pattern suggests a rebound toward current levels.