Skip to content
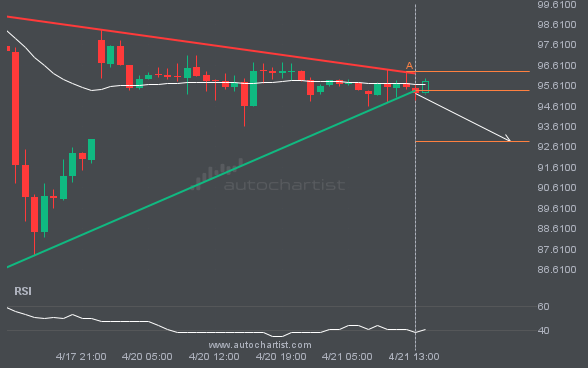
 BRN/USD has broken through the support line of a Triangle technical chart pattern. Because it has retraced from this line in the past, you should wait for confirmation of the breakout before taking any action. It has touched this line twice in the last 5 days, which suggests a possible target around 92.8832 within the […]
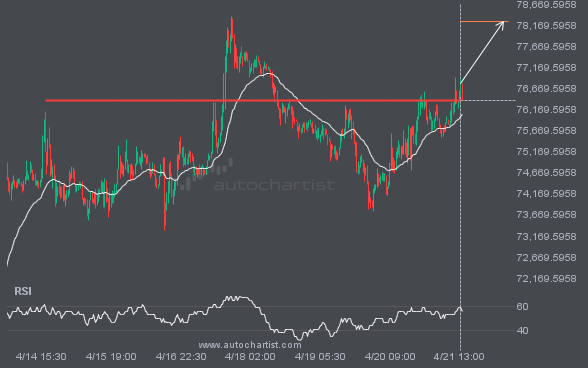
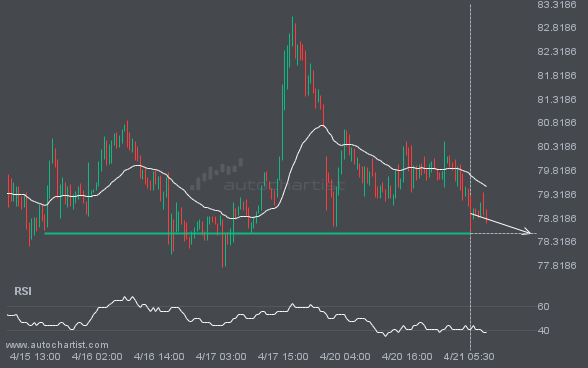
BTCUSD has broken through a level at 76393.5781, suggesting a possible move to 78263.2656 within the next 2 days. It has tested this level numerous times in the past, so you should wait for confirmation of this breakout before taking any action. If the breakout does not confirm, we could see a retracement back to […]
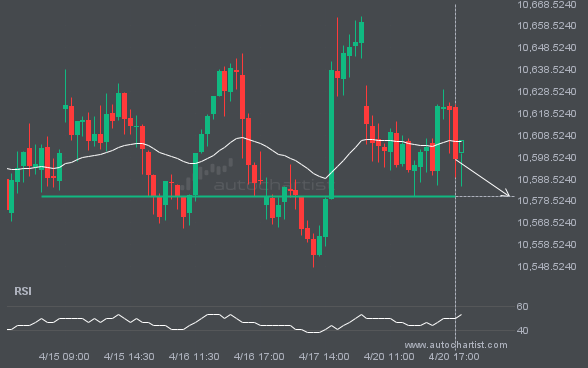
FTSE100 is moving toward a level at 10580.7305, which it has tested many times before. We have seen it retrace from this level before, so at this stage it isn’t clear whether it will break through this price or rebound again. If FTSE100 continues on its current trajectory, we may see it move toward 10580.7305 […]
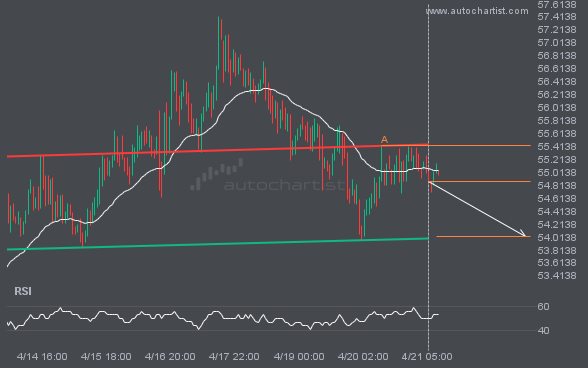
A Head and Shoulders pattern was identified for LTCUSD at 54.87, suggesting it may move toward the support line at 54.0245. It may break through that line and continue the bearish trend, or reverse from it.
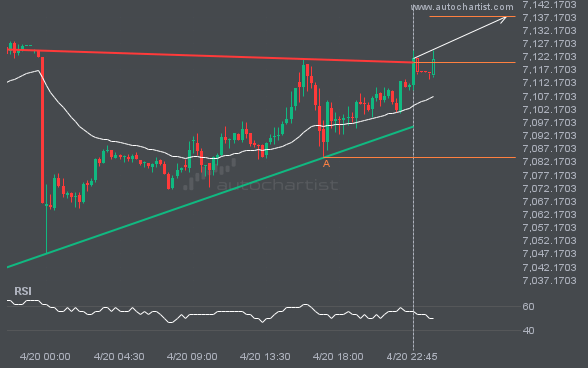
S&P500 has broken through the resistance line of a Ascending Triangle technical chart pattern. Because it has retraced from this line in the past, you should wait for confirmation of the breakout before taking any action. It has touched this line twice in the last 4 days, which suggests a possible target around 7137.4023 within […]
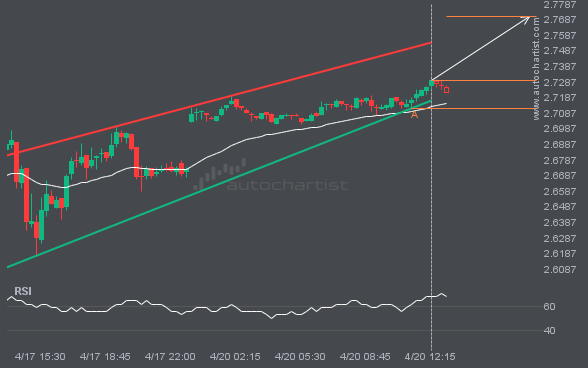
NGC/USD is heading toward the resistance line in a Pennant pattern. If this move continues, the price of NGC/USD could test 2.7707 within the next 6 hours. It has tested this line many times before, so the move could be short-lived and may rebound as it has before.