Skip to content
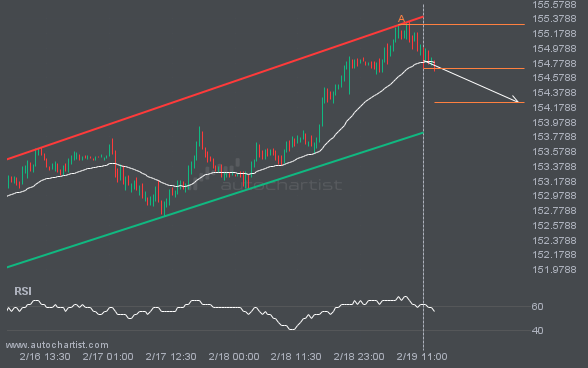
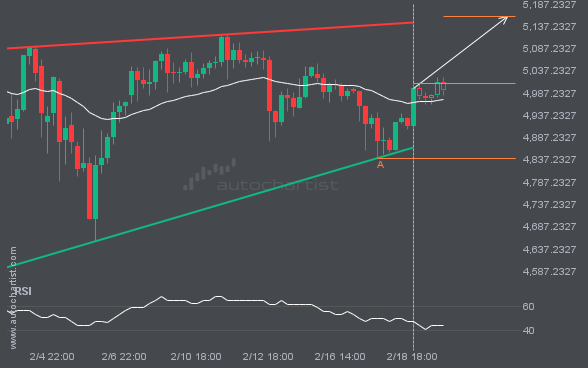
 USDJPY is trapped in a Channel Up formation, implying that a breakout is imminent. This is a strong trade setup for both trend and swing traders. It is now approaching a resistance line that has been tested before. Divergence watchers may be optimistic about a potential breakout, which could mark the start of a new […]
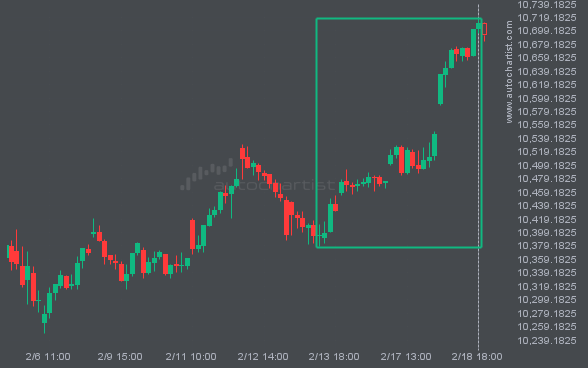
XAUUSD is moving toward a resistance line. Since it has retraced from this line before, we may see either a breakout through it or a rebound to current levels. It has touched this line multiple times in the past 17 days and may test it again within the next 3 days.
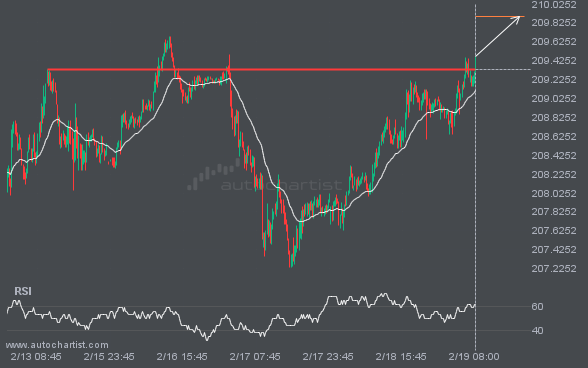
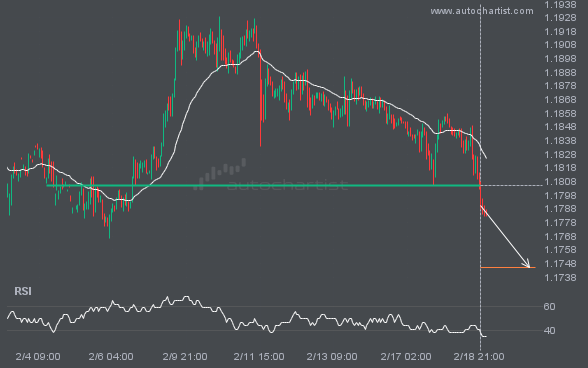
GBPJPY is once again retesting a key horizontal resistance level at 209.3365. This level has been tested 3 times recently and could see another bounce, as it did last time. However, after so many attempts, it may be ready to start a new trend.
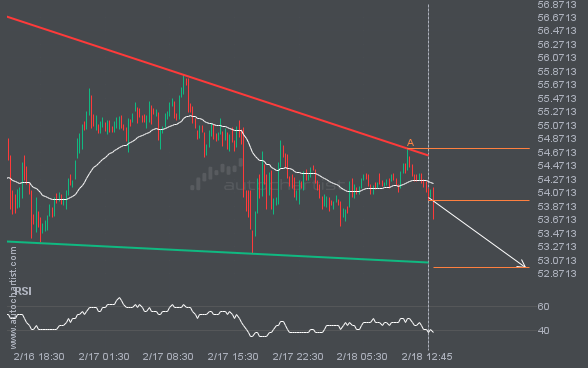
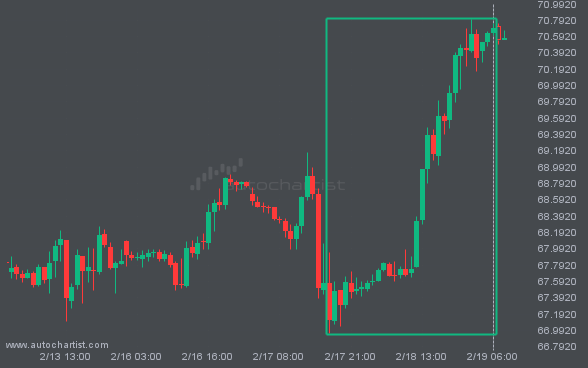
LTCUSD is trapped in a Falling Wedge formation, implying that a breakout is imminent. This is a strong trade setup for both trend and swing traders. It is now approaching a resistance line that has been tested before. Divergence watchers may be optimistic about a potential breakout, which could mark the start of a new […]