Daily Top Trade Setups: Advanced Forex, Indices, Commodities, and Stock Analysis
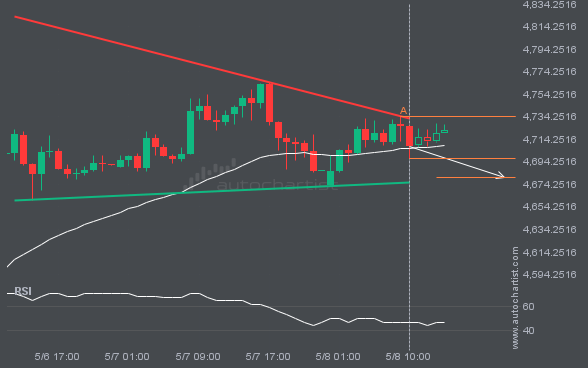
XAUUSD is approaching the support line of a Triangle pattern. We anticipate either a breakout through this line or a rebound.
An emerging Triangle pattern in its final wave has been identified on the XAUUSD 1 hour chart. After a strong bearish run, XAUUSD is heading toward the upper triangle trendline, with possible resistance at 4680.1062. If the support holds, the Triangle pattern suggests a rebound toward current levels.
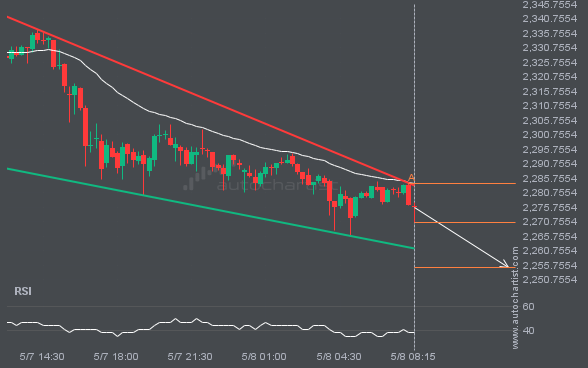
ETHUSD is approaching a support line of a Falling Wedge. It has touched this line numerous times in the last 19 hours.
A Falling Wedge pattern was identified for ETHUSD at 2270.46, suggesting it may move toward the support line at 2255.0476. It may break through that line and continue the bearish trend, or reverse from it.
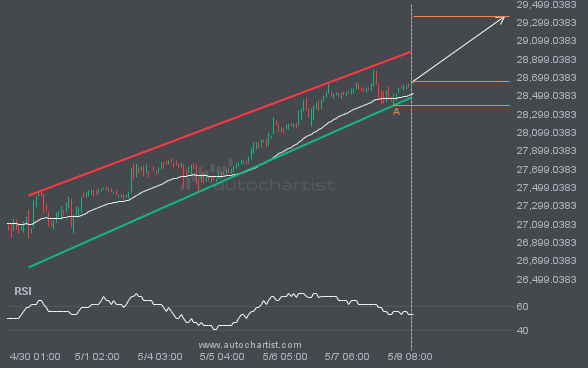
Consider a move on NAS100 as it heads toward resistance.
NAS100 is heading toward the resistance line in a Channel Up pattern. If this move continues, the price of NAS100 could test 29362.2249 within the next 3 days. It has tested this line many times before, so the move could be short-lived and may rebound as it has before.
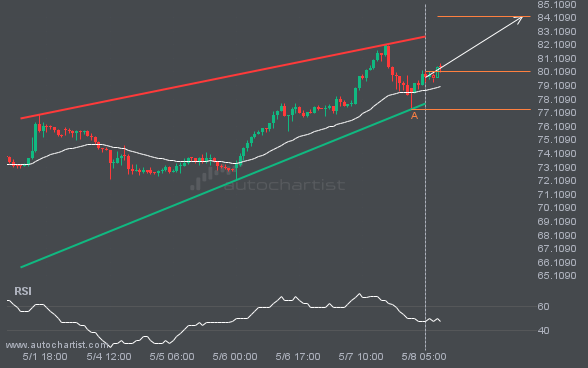
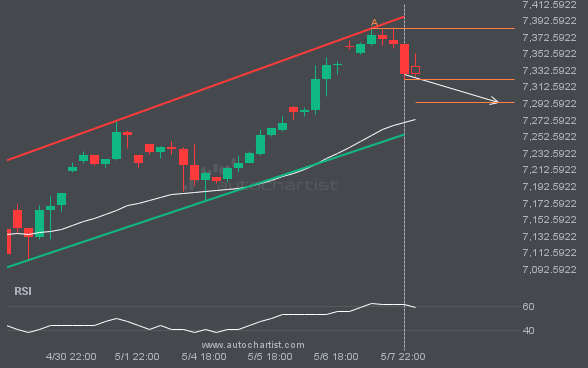
XAGUSD is signaling a possible trend reversal on intraday charts, as the price fails to breach support.
XAGUSD is moving toward a resistance line. Since it has retraced from this line before, we may see either a breakout through this line or a rebound to current levels. It has touched this line numerous times in the last 7 days and may test it again within the next 2 days.
S&P500 is approaching the support line of a Channel Up pattern. We anticipate either a breakout through this line or a rebound.
S&P500 is moving toward a support line. Since it has retraced from this line before, we may see either a breakout through this line or a rebound to current levels. It has touched this line numerous times in the last 9 days and may test it again within the next 2 days.
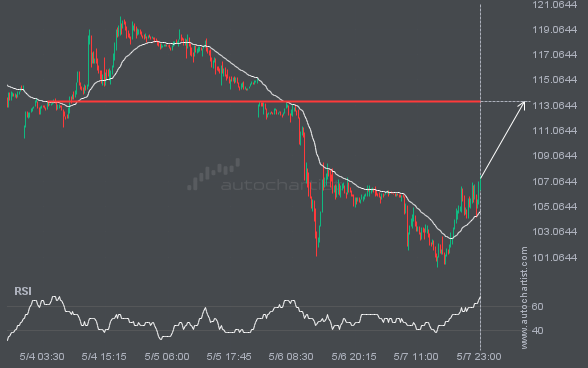
BRN/USD is heading toward a price it has tested 3 times recently.
A strong resistance level has been identified at 113.3880 on the 15 Minutes BRN/USD chart. BRN/USD is likely to test this level soon.
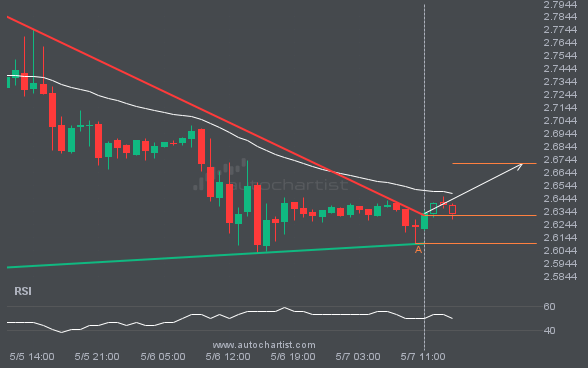
Resistance line has been breached by NGC/USD. This price level has been tested at least twice before.
The last 3 1 hour candles on NGC/USD have formed a Triangle pattern and broken out through the pattern lines, indicating a possible bullish movement toward the price level at 2.6716.
Latest company news, corporate actions and partnership announcements
February 18, 2025, BOSTON, Mass. – oneZero, the global leading provider of multi-asset enterprise technology solutions for trade execution and risk management for banks, brokers and buy side market participants, today announced the acquisition of Autochartist, a leading provider of client engagement automation through market data-driven content. The acquisition creates a mutually beneficial relationship, enhancing […]
Autochartist’s Research Portal provides brokers with a convenient hub for dynamic market analysis and trading tools. EAERA is excited to announce its latest partnership with Autochartist, a leader in financial market analysis and data-driven solutions for broker platforms. Autochartist’s Research Portal is now available through EAERA and is the perfect addition to its impressive product […]
Autochartist was awarded the prestigious “Best Software for Swing Trading” title at the 2024 Benzinga Global Fintech Awards, a landmark financial technology event in New York City. The Benzinga Global Fintech Awards, now in their tenth year, have a rigorous selection process. The finalists are scrutinised and independently judged based on numerous factors, including innovation, […]
Autochartist, a prominent financial market analysis provider, earned the Most Comprehensive Market Analysis Provider award in the FinanceFeeds Awards 2024. Founded in 2004, Autochartist has transformed the trading industry with its data-driven market analysis. Providing traders and brokers with a powerful suite of tools to help them navigate the complexities of financial markets. Over two decades, Autochartist […]
You can read the entire case study here to learn more about the impact of the Autochartist integration with SparkMarkets. Integrating Autochartist’s advanced technical analysis within SparkMarkets’ platform has empowered traders with actionable insights that are seamlessly accessible. Consequently, users can move from signal generation to trade execution faster than ever before, enhancing decision-making and improving trading […]
Autochartist, a global leader in trading solutions, automated content and technical analysis, is proud to announce its latest integration offering for brokers. Marketo, a comprehensive marketing automation platform known for its advanced capabilities, is a popular choice among online brokerage firms. Autochartist maintains a solid reputation for offering its services across the most-used platforms around […]
Technical analysis remains a fundamental tool for traders seeking to understand market dynamics and make informed decisions in 2024 and beyond. Advanced tools that use technical analysis and pattern recognition empower traders in ways previous generations couldn’t have imagined. Automatic identification of trading opportunities enables traders to fine-tune their strategies with increased confidence and complete […]
Cryptocurrency exchange-traded funds (ETFs) have emerged as a hot topic in the financial world, seeking to bridge the gap between traditional finance and the crypto market. As traders seek innovative ways to diversify their portfolios and capitalize on market trends, understanding crypto ETFs is a good starting point. What is a Spot Bitcoin ETF? A […]
What if the next generation of traders doesn’t care about traditional investments? Gen Z, born between 1997 and 2012, continues to demonstrate a significant force in retail trading and investment. Their unique approach to investing, heavily influenced by social media and a preference for alternative assets, marks a departure from traditional trading strategies, and brokers […]
Brokers face the continuous challenge of adapting their strategies to meet the diverse needs of multiple generational cohorts. From tech-savvy Generation Z to the conservative Silent Generation, addressing the unique preferences of each demographic begins with an understanding of their varying needs and behaviours. This article explores how Autochartist can help brokers attract, retain, and […]
For new traders, the first encounter with a trading platform can often feel like stepping into the cockpit of an aircraft—intimidating and overloaded with information. The array of charts, tools, and data feeds essential for effective trading can become obstacles instead of aids. Here’s how brokers can play a crucial role in transforming this complexity […]
Anyone who ventures into online investing understands that trading has an inherent risk. That first trade is nerve-wracking, no matter how prepared you think you are. Many brokers focus only on the tools their clients need to execute trades efficiently – often neglecting to help clients, especially new traders, understand the choices surrounding a sound […]