Daily Top Trade Setups: Advanced Forex, Indices, Commodities, and Stock Analysis
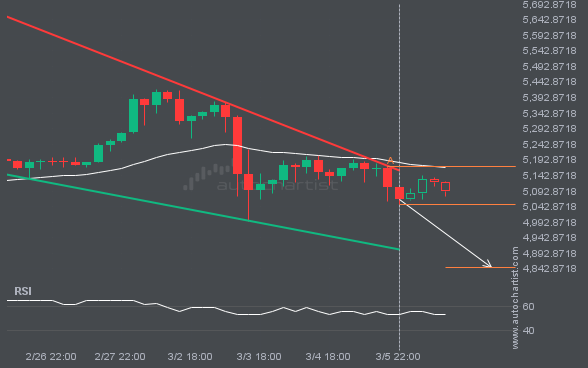
After repeatedly testing the support line, XAUUSD is once again approaching it. Can we expect a bearish trend to emerge?
XAUUSD is heading toward the support line of a Falling Wedge pattern and could reach it within the next 2 days. It has tested this line numerous times before, and this time may be no different, ending in a rebound instead of a breakout. If a breakout doesn’t occur, we could see a retracement back […]
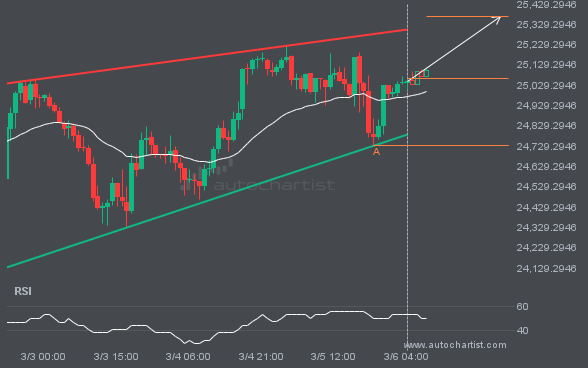
After repeatedly testing the resistance line, NAS100 is once again approaching it. Can we expect a bullish trend to emerge?
NAS100 is trapped in a Rising Wedge formation, implying that a breakout is imminent. This is a strong trade setup for both trend and swing traders. It is now approaching a support line that has been tested before. Divergence watchers may be optimistic about a potential breakout, which could mark the start of a new […]
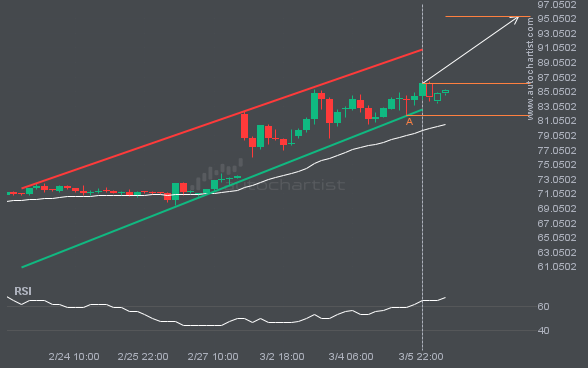
BRN/USD has formed a Channel Up on the 4 hour chart. A retest of resistance is in sight.
BRN/USD was identified around 86.188 after recently rebounding off the support on the 4 hour interval. Ultimately, the stock’s price action has formed a Channel Up pattern. This squeeze may increase the chances of a strong breakout. The projected move could take the price to around 95.3328.
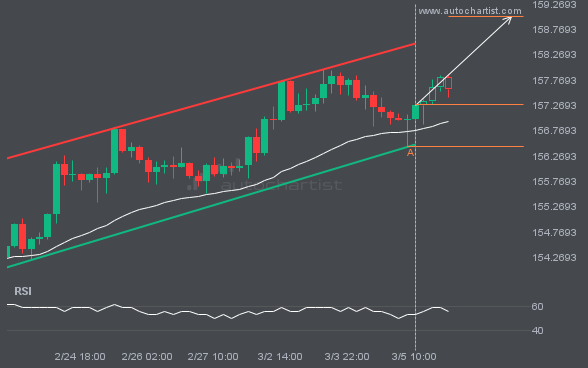
An important resistance line is being approached by USDJPY. This price has been tested numerous times in the last 14 days
USDJPY is heading toward the resistance line of a Channel Up pattern and could reach it within the next 2 days. It has tested this line numerous times before, and this time may be no different, ending in a rebound instead of a breakout. If a breakout doesn’t occur, we could see a retracement back […]
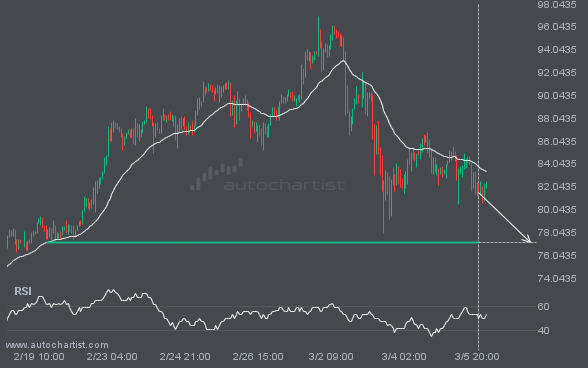
XAGUSD appears to be approaching support—a potential opportunity?
XAGUSD is moving toward a key support level at 77.1916. This level has been tested before for XAGUSD. This may present a good trading opportunity either at the spot price or after a breakout through this level.
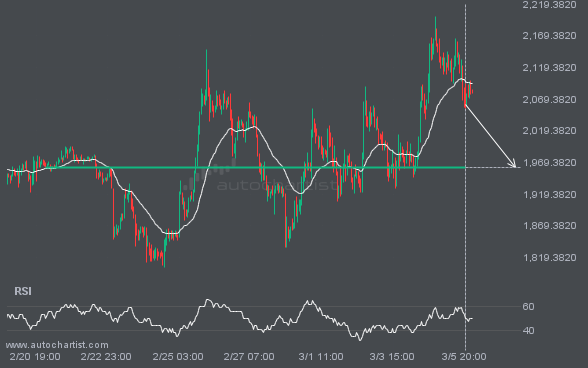
ETHUSD is quickly approaching an important level it has tested many times before.
ETHUSD is heading toward 1960.8500 and could reach this level within the next 3 days. It has tested this level numerous times in the past, and this time could be no different, ending in a rebound rather than a breakout. If a breakout does not occur, we may see a retracement back to current levels.
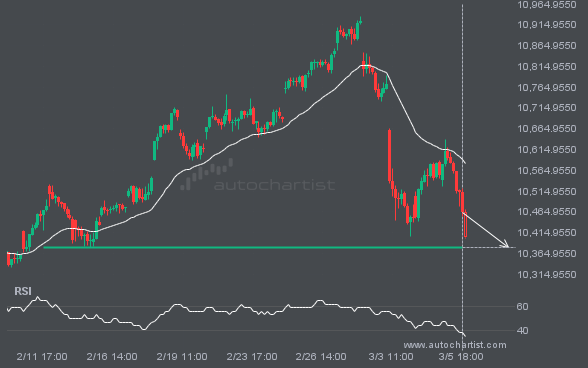
FTSE100 appears to be approaching support—a potential opportunity?
FTSE100 is heading toward 10378.5498 and could reach this level within the next 2 days. It has tested this level numerous times in the past, and this time could be no different, ending in a rebound rather than a breakout. If a breakout does not occur, we may see a retracement back to current levels.
Latest company news, corporate actions and partnership announcements
Interesting trading articles, ideas, and thought leadership
Ask your broker today or sign up for a demo from the Technical Analysis page.