 Skip to content
 ETHUSD is moving toward a resistance line. Since it has retraced from this line before, we may see either a breakout through it or a rebound to current levels. It has touched this line multiple times in the past 10 days and may test it again within the next 2 days.

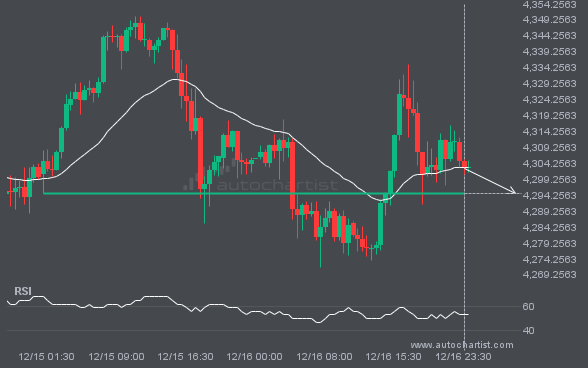
XAUUSD is heading toward 4294.9048 and could reach this level within the next 10 hours. It has tested this level numerous times in the past, and this time could be no different, ending in a rebound rather than a breakout. If a breakout does not occur, we may see a retracement back to current levels.
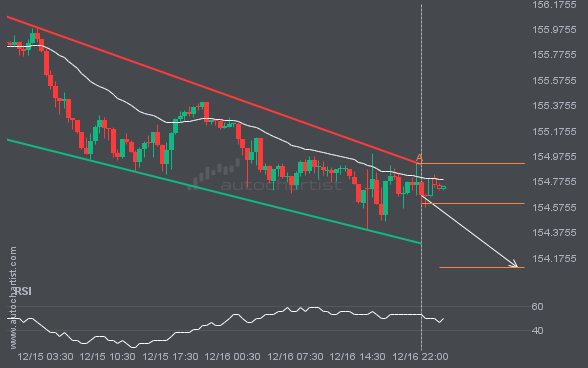
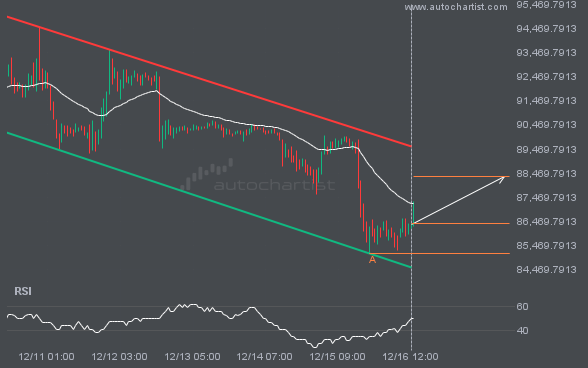
USDJPY is trapped in a Channel Down formation, implying that a breakout is imminent. This is a strong trade setup for both trend and swing traders. It is now approaching a resistance line that has been tested before. Divergence watchers may be optimistic about a potential breakout, which could mark the start of a new […]
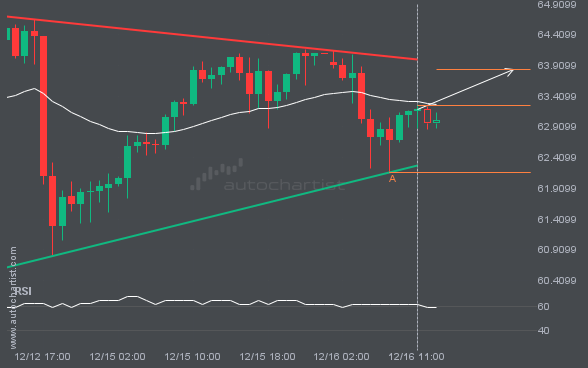
XAGUSD is trapped in a Triangle formation, implying that a breakout is imminent. This is a strong trade setup for both trend and swing traders. It is now approaching a support line that has been tested before. Divergence watchers may be optimistic about a potential breakout, which could mark the start of a new trend. […]
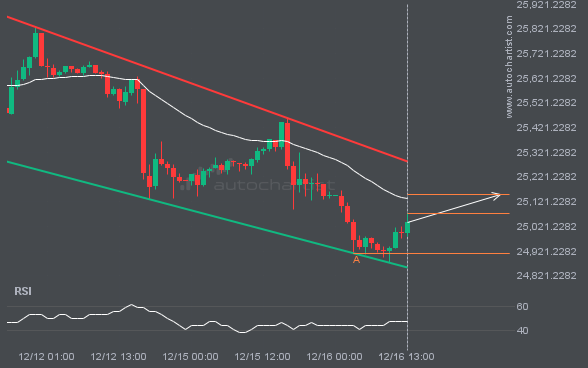
An emerging Channel Down has been detected on NAS100. The pattern has not yet broken through support, but the price is expected to move up over the next few hours. At the time the pattern was found, the price was 25075.4569, and it is expected to move to 25149.5324.
GBPJPY is moving toward a resistance line. Because it has retraced from this level in the past, we may see either a breakout through this line or a rebound to current levels. It has touched this line multiple times over the last 7 days and may test it again within the next 2 days.
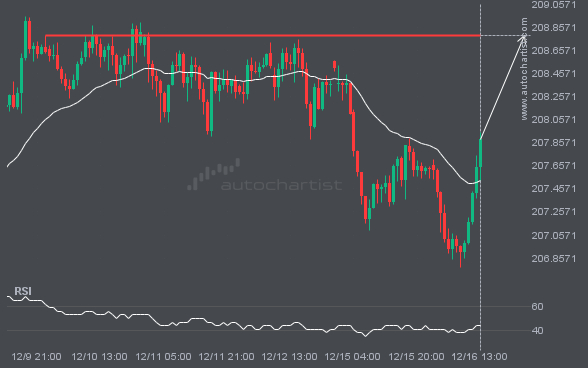
BTCUSD is moving toward a resistance line. Since it has retraced from this line before, we may see either a breakout through it or a rebound to current levels. It has touched this line multiple times in the past 8 days and may test it again within the next 2 days.

