Daily Top Trade Setups: Advanced Forex, Indices, Commodities, and Stock Analysis
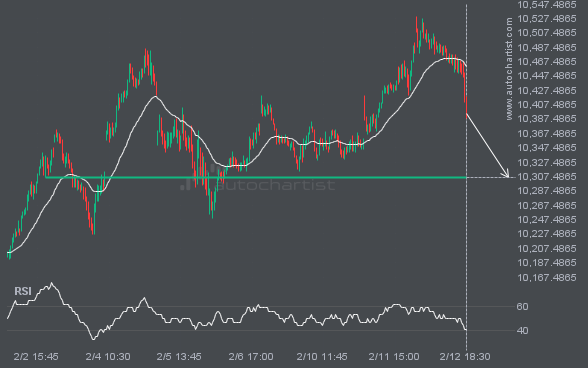
If you’re long on FTSE100, be aware of the rapidly approaching level at 10305.5098.
FTSE100 is heading toward 10305.5098 and could reach this level within the next 17 hours. It has tested this level numerous times in the past, and this time could be no different, ending in a rebound rather than a breakout. If a breakout does not occur, we may see a retracement back to current levels.
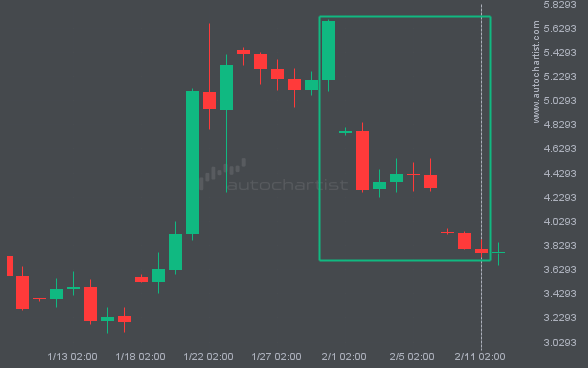
An unexpectedly large move occurred on the NGC/USD Daily chart. The shift stands out in recent activity.
NGC/USD has moved lower by 33.83% from 5.686 to 3.7625 in the last 13 days.
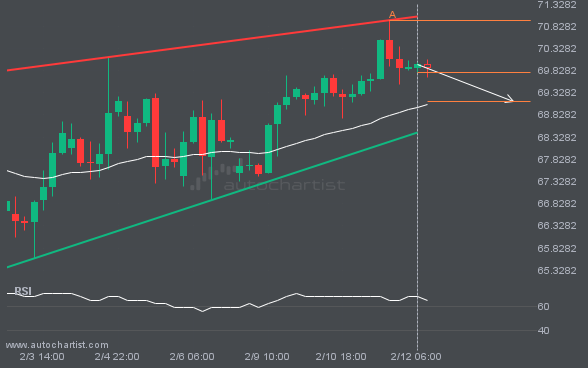
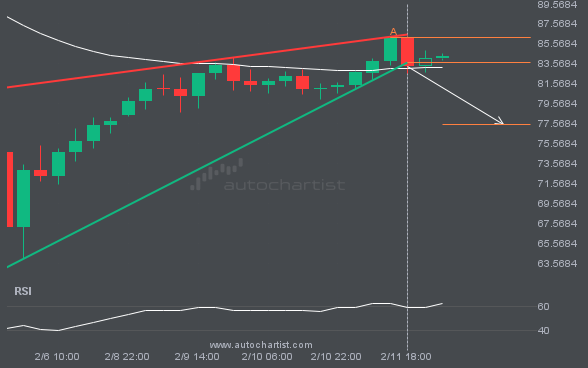
A Rising Wedge has formed, and BRN/USD is approaching resistance. Should we expect a breakout and the start of a new trend, or a reversal?
A Rising Wedge pattern was identified for BRN/USD at 69.774, suggesting it may move toward the support line at 69.1426. It may break through that line and continue the bearish trend, or reverse from it.
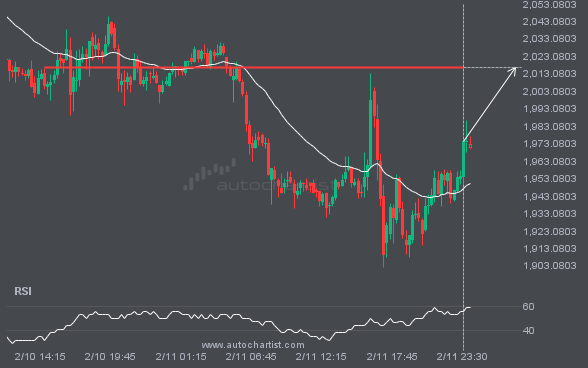
ETHUSD is heading toward a price it has tested 3 times recently.
A strong resistance level has been identified at 2016.8300 on the 15 Minutes ETHUSD chart. ETHUSD is likely to test this level soon.
There may be a significant move in XAGUSD following a breach of support.
This trade setup on XAGUSD formed after a period of consolidation, during which the price moved mostly sideways before choosing a longer-term direction. Following the bearish breakout through support, the price could move toward 77.5370.
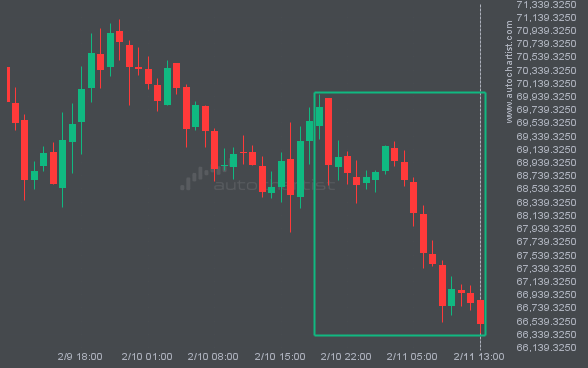
Big bearish swing in BTCUSD – this may be one of its more notable moves in the latest session.
A movement of 4.71% over 18 hours on BTCUSD does not go unnoticed. You may want to consider where it is heading next: a continuation of the current downward trend or a reversal of the prior trend.
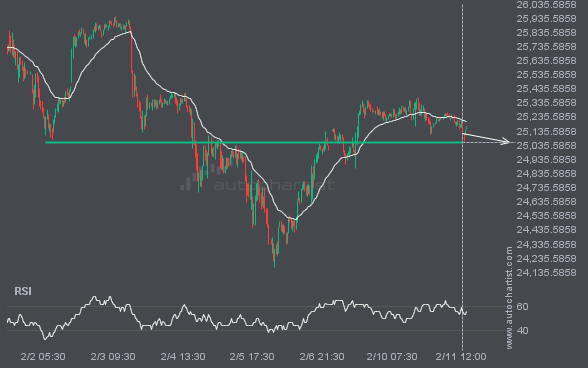
NAS100 is approaching a price it has tested 6 times recently.
NAS100 is heading toward 25052.8320 and could reach this level within the next 2 days. It has tested this level numerous times in the past, and this time could be no different, ending in a rebound rather than a breakout. If a breakout does not occur, we may see a retracement back to current levels.
Latest company news, corporate actions and partnership announcements
Interesting trading articles, ideas, and thought leadership
Ask your broker today or sign up for a demo from the Technical Analysis page.