Daily Top Trade Setups: Advanced Forex, Indices, Commodities, and Stock Analysis
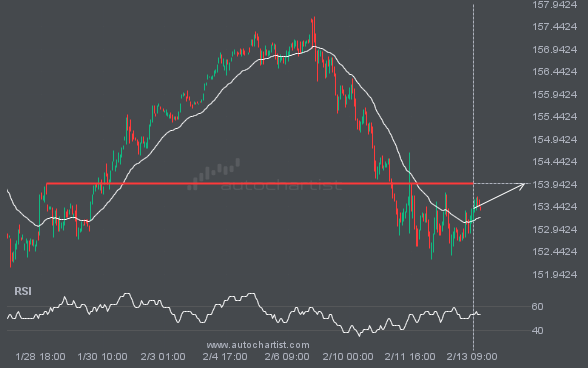
USDJPY is likely to test 153.9560 in the near future. Where to next?
USDJPY is heading toward 153.9560 and could reach this level within the next 3 days. It has tested this level numerous times in the past, and this time could be no different, ending in a rebound rather than a breakout. If a breakout does not occur, we may see a retracement back to current levels.
A Falling Wedge has formed, and S&P500 is approaching resistance. Should we expect a breakout and the start of a new trend, or a reversal?
S&P500 is moving toward a support line. Since it has retraced from this line before, we may see either a breakout through it or a rebound to current levels. It has touched this line multiple times in the past 2 days and may test it again within the next 6 hours.
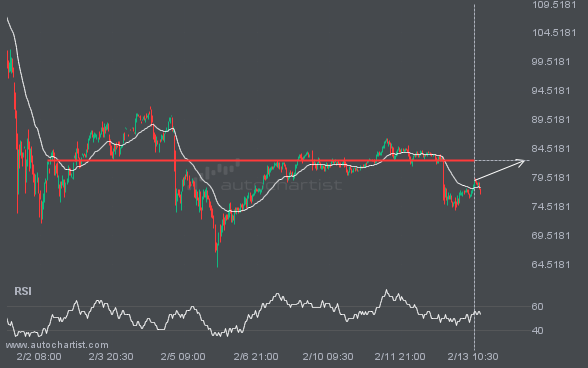
XAGUSD keeps moving closer to 82.4759. Will it finally breach this level?
The price of XAGUSD is heading back toward the resistance area. It may struggle to break through and could reverse direction. The price may eventually break through, but it typically retreats from the level several times before doing so.
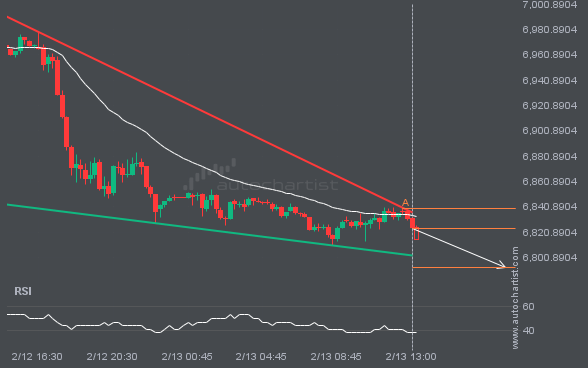
Because BTCUSD has formed a Channel Down pattern, we expect it to touch the resistance line. If it breaks through the resistance, it may move much higher.
BTCUSD is heading toward the resistance line of a Channel Down pattern and could reach it within the next 6 hours. It has tested this line numerous times before, and this time may be no different, ending in a rebound instead of a breakout. If a breakout doesn’t occur, we could see a retracement back […]
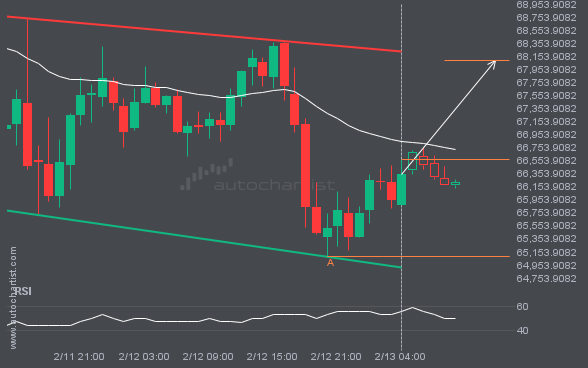
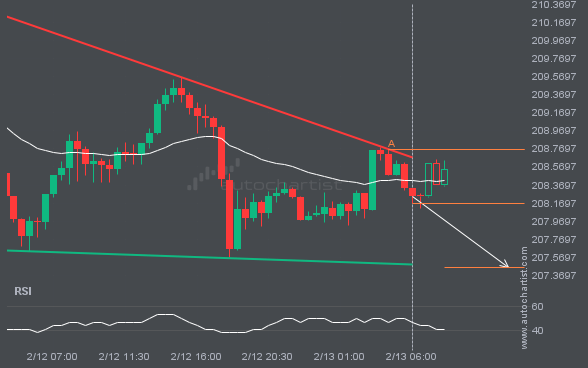
GBPJPY is approaching a support line of a Descending Triangle. It has touched this line numerous times in the last 2 days.
An emerging Descending Triangle pattern in its final wave has been identified on the GBPJPY 30 Minutes chart. After a strong bearish run, GBPJPY is heading toward the upper triangle trendline, with possible resistance at 207.4598. If the support holds, the Descending Triangle pattern suggests a rebound toward current levels.
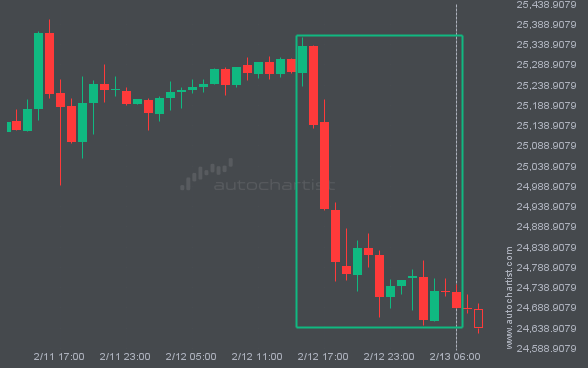
NAS100 reached 24687.0919 after a move of 2.55% spanning 15 hours.
NAS100 just posted a 2.55% move over the past 15 hours—a move unlikely to go unnoticed by any trading style.
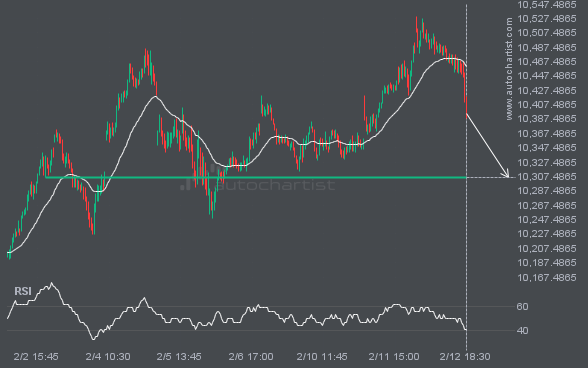
If you’re long on FTSE100, be aware of the rapidly approaching level at 10305.5098.
FTSE100 is heading toward 10305.5098 and could reach this level within the next 17 hours. It has tested this level numerous times in the past, and this time could be no different, ending in a rebound rather than a breakout. If a breakout does not occur, we may see a retracement back to current levels.
Latest company news, corporate actions and partnership announcements
Interesting trading articles, ideas, and thought leadership
Ask your broker today or sign up for a demo from the Technical Analysis page.