Daily Top Trade Setups: Advanced Forex, Indices, Commodities, and Stock Analysis
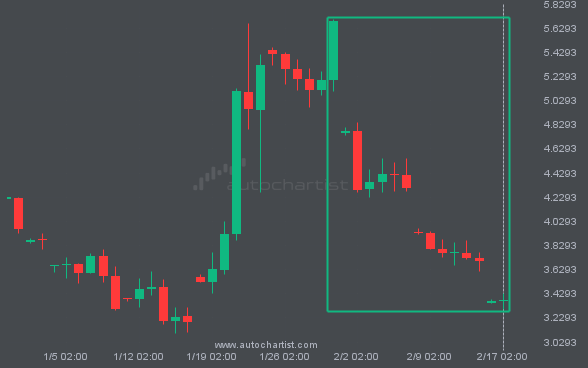
NGC/USD — large moves like this tend to attract attention.
NGC/USD just posted a 40.78% move over the past 19 days—a move unlikely to go unnoticed by any trading style.
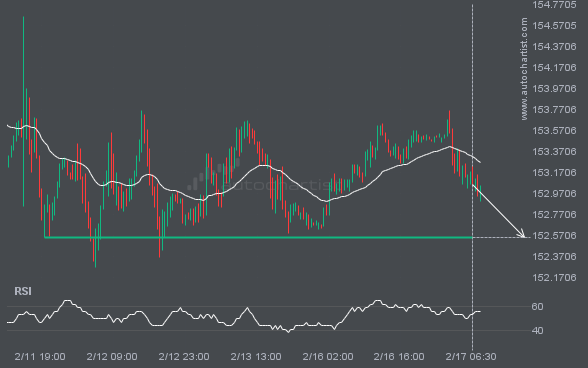
After repeatedly testing the 152.5530 level, USDJPY is once again approaching it. Should we expect a bearish trend to follow?
USDJPY is moving toward a level at 152.5530, which it has tested many times before. We have seen it retrace from this level before, so at this stage it isn’t clear whether it will break through this price or rebound again. If USDJPY continues on its current trajectory, we may see it move toward 152.5530 […]
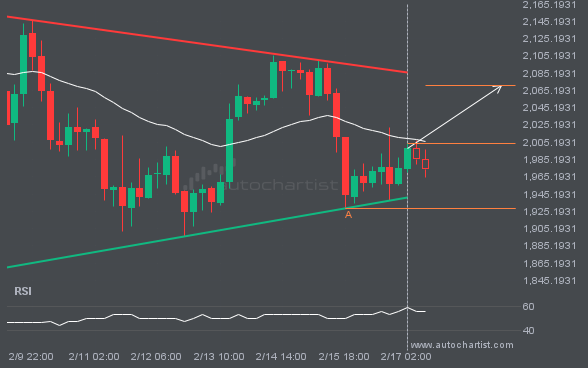
ETHUSD is approaching a resistance line of a Triangle. It has touched this line numerous times in the last 12 days.
An emerging Triangle has been detected on ETHUSD. The pattern has not yet broken through support, but the price is expected to move up over the next few hours. At the time the pattern was found, the price was 2003.25, and it is expected to move to 2070.8748.
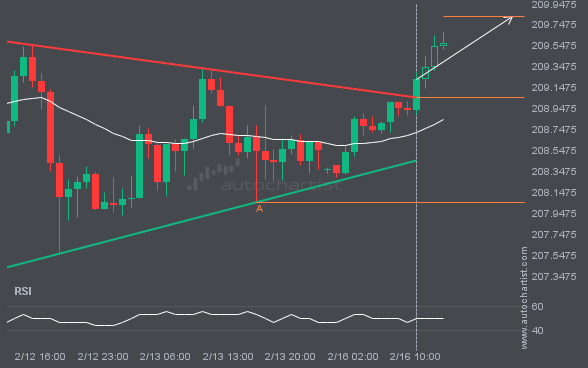
An interesting opportunity in GBPJPY after breaking 209.0567105263158.
A breakout of GBPJPY through the resistance line of a Triangle could signal what’s ahead. If the breakout persists, we may see GBPJPY’s price test 209.8277 within the next 10 hours.
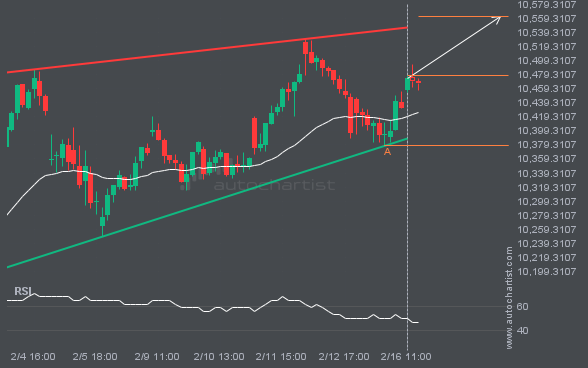
BRN/USD is approaching a resistance line of a Rising Wedge. It has touched this line numerous times in the last 4 days.
The movement of BRN/USD toward the resistance line of a Rising Wedge is yet another test of the line it has reached numerous times in the past. This test of the line could occur within the next 7 hours, but it is uncertain whether it will result in a breakout through this line or simply […]
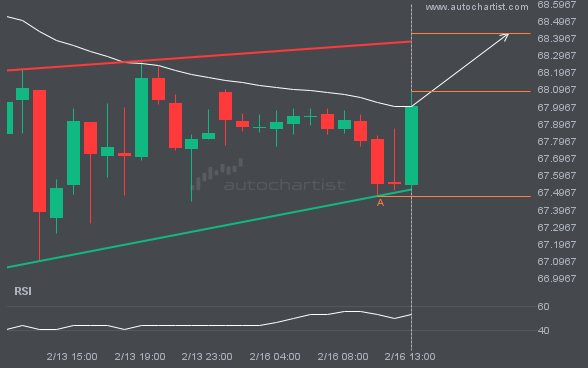
FTSE100 is approaching the resistance line of a Rising Wedge pattern. We anticipate either a breakout through this line or a rebound.
FTSE100 is moving toward a resistance line it has tested many times. It has retraced from this line before, so it’s unclear whether it will break through or rebound again. If FTSE100 continues on its current trajectory, it could reach 10561.4969 within the next 19 hours.
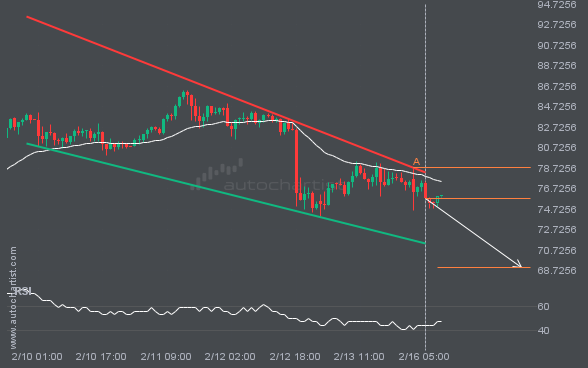
XAGUSD is approaching a support line of a Falling Wedge. It has touched this line numerous times in the last 7 days.
XAGUSD is heading toward the support line of a Falling Wedge pattern and could reach it within the next 2 days. It has tested this line numerous times before, and this time may be no different, ending in a rebound instead of a breakout. If a breakout doesn’t occur, we could see a retracement back […]
Latest company news, corporate actions and partnership announcements
Interesting trading articles, ideas, and thought leadership
Ask your broker today or sign up for a demo from the Technical Analysis page.