Skip to content
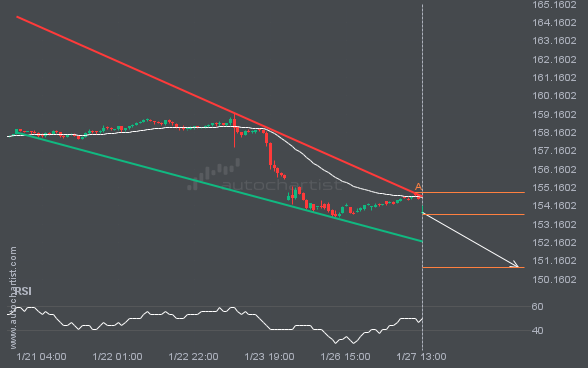
 An emerging Falling Wedge pattern has been detected for USDJPY on the 1 hour chart. There may be a move toward 150.7935 in the next few candles. Once it reaches the support, it may continue its bearish run or revert to current price levels.
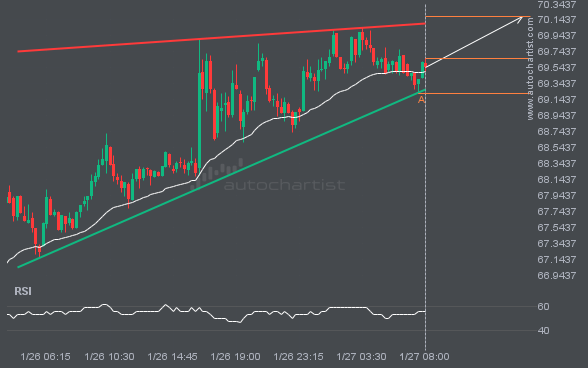
S&P500 has broken through the resistance line of a Triangle technical chart pattern. Because it has retraced from this line in the past, you should wait for confirmation of the breakout before taking any action. It has touched this line twice in the last 13 days, suggesting a possible target level around 7027.2055 within the […]
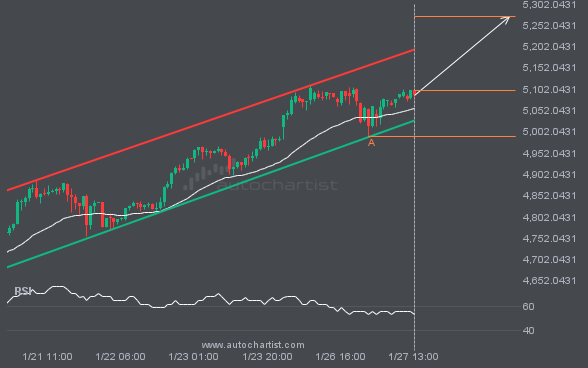
XAUUSD is heading toward the resistance line of a Channel Up pattern and could reach it within the next 2 days. It has tested this line numerous times before, and this time may be no different, ending in a rebound instead of a breakout. If a breakout doesn’t occur, we could see a retracement back […]
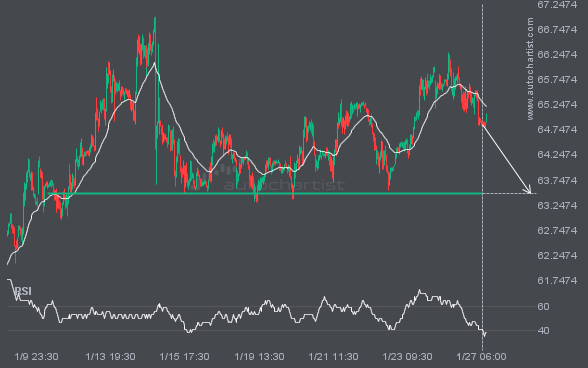
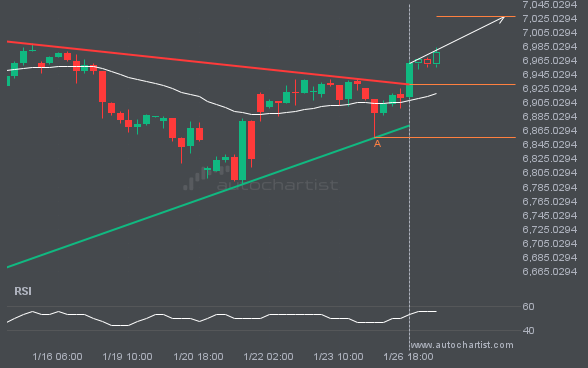
BRN/USD is moving toward a support line. Because it has retraced from this level in the past, we may see either a breakout through this line or a rebound to current levels. It has touched this line multiple times over the last 16 days and may test it again within the next 3 days.
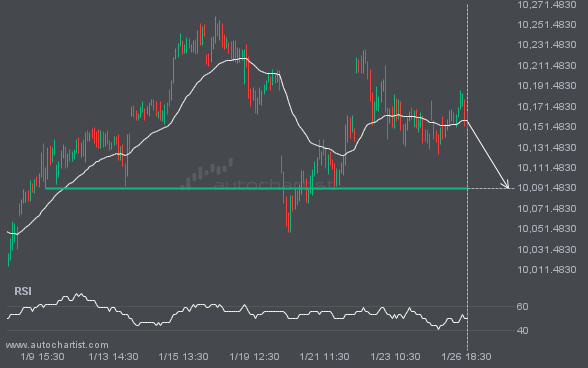
FTSE100 is moving toward a level at 10091.4600, which it has tested many times before. We have seen it retrace from this level before, so at this stage it isn’t clear whether it will break through this price or rebound again. If FTSE100 continues on its current trajectory, we may see it move toward 10091.4600 […]
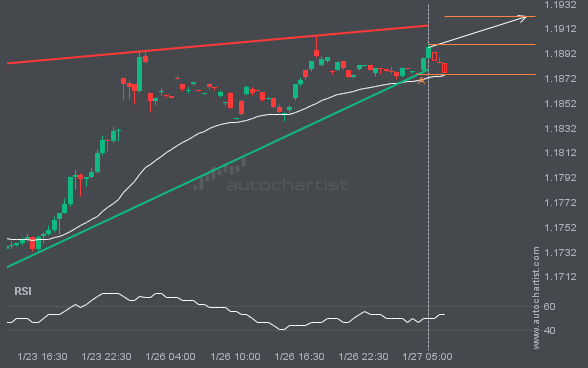
EURUSD is moving toward a resistance line it has tested many times. It has retraced from this line before, so it’s unclear whether it will break through or rebound again. If EURUSD continues on its current trajectory, it could reach 1.1922 within the next 9 hours.