Skip to content
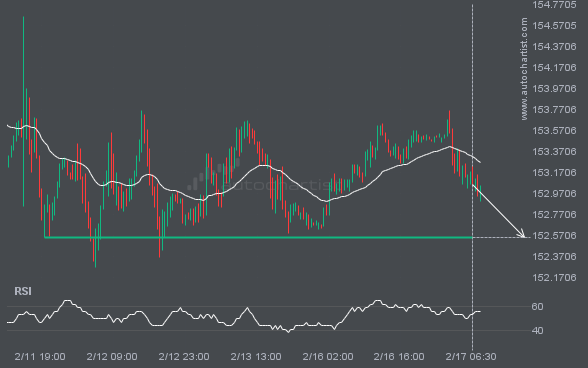
USDJPY is moving toward a level at 152.5530, which it has tested many times before. We have seen it retrace from this level before, so at this stage it isn’t clear whether it will break through this price or rebound again. If USDJPY continues on its current trajectory, we may see it move toward 152.5530 […]
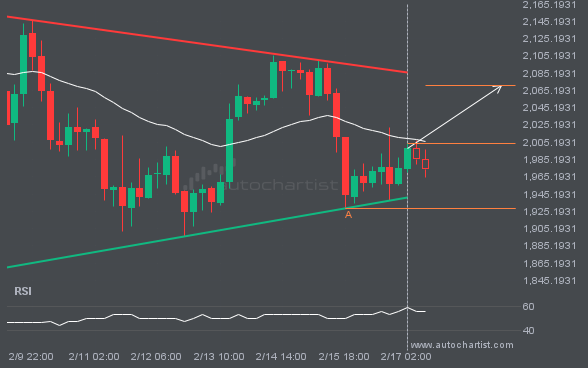
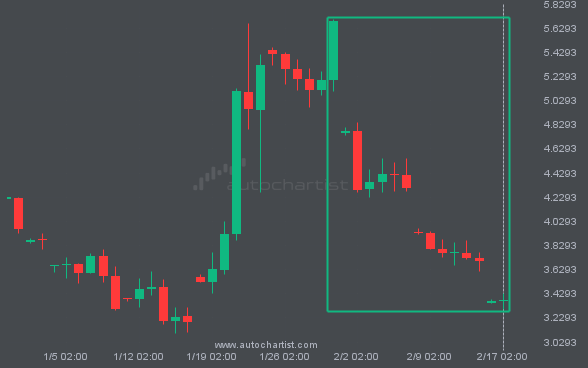
An emerging Triangle has been detected on ETHUSD. The pattern has not yet broken through support, but the price is expected to move up over the next few hours. At the time the pattern was found, the price was 2003.25, and it is expected to move to 2070.8748.
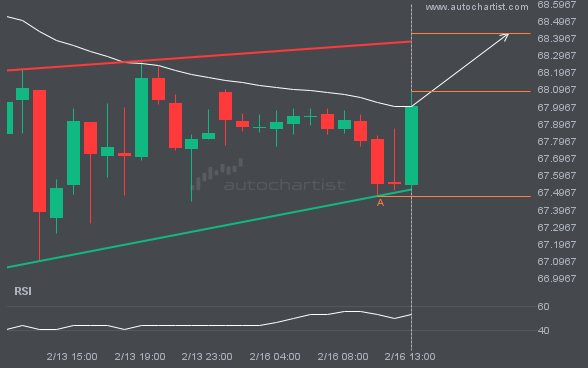
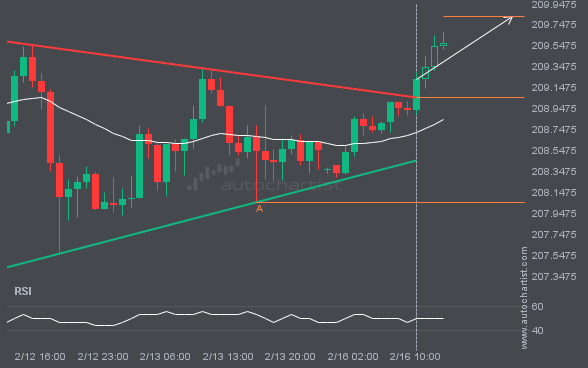
The movement of BRN/USD toward the resistance line of a Rising Wedge is yet another test of the line it has reached numerous times in the past. This test of the line could occur within the next 7 hours, but it is uncertain whether it will result in a breakout through this line or simply […]
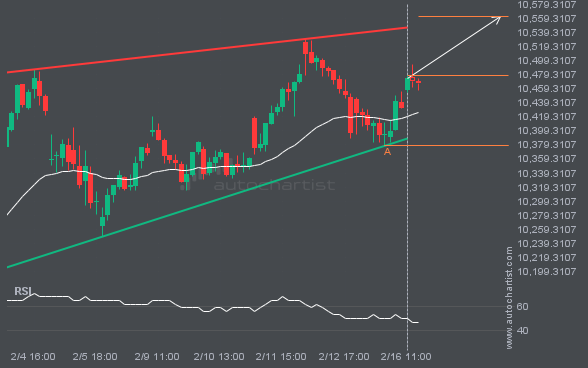
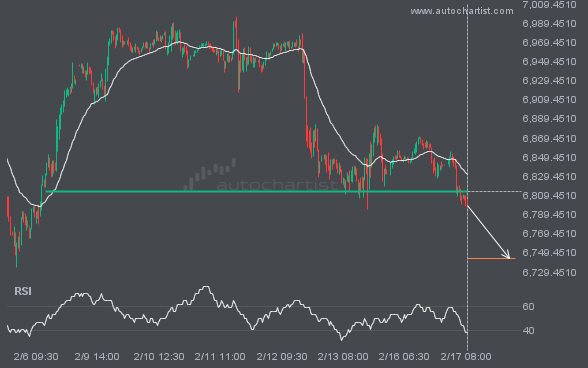
FTSE100 is moving toward a resistance line it has tested many times. It has retraced from this line before, so it’s unclear whether it will break through or rebound again. If FTSE100 continues on its current trajectory, it could reach 10561.4969 within the next 19 hours.