Skip to content
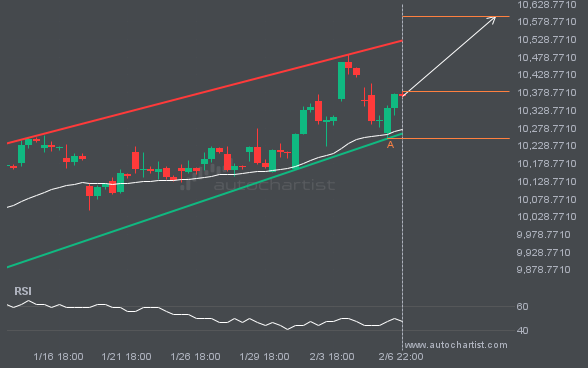
 An emerging Channel Up pattern has been detected for FTSE100 on the 4 hour chart. There may be a move toward 10593.3946 in the next few candles. Once it reaches the resistance, it may continue its bullish run or revert to current price levels.
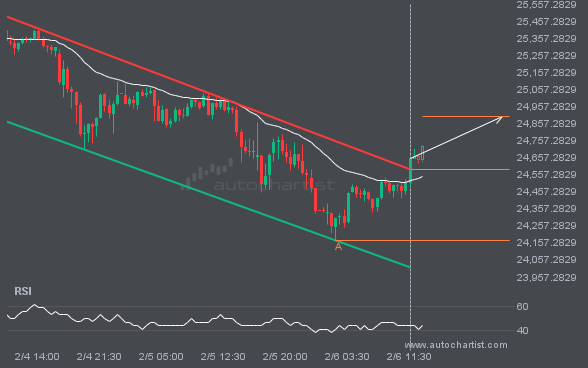
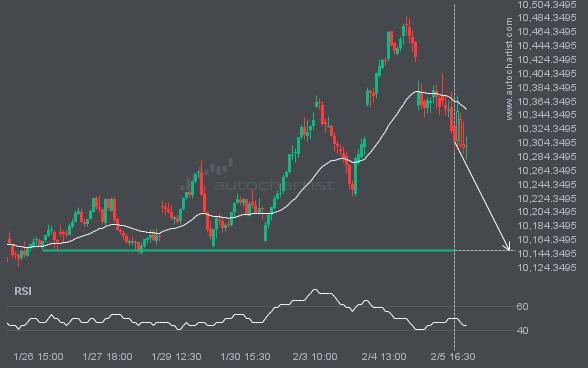
NAS100 has broken through the resistance line of a Channel Down pattern and suggests a possible move to 24898.8753 within the next 13 hours. It has tested this line before, so it is prudent to wait for confirmation of the breakout before taking action. If the breakout is not confirmed, we could see a retracement […]
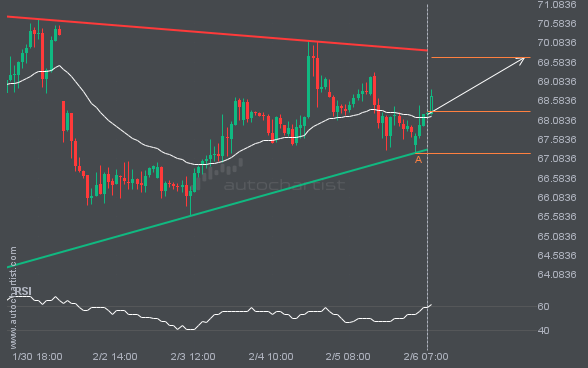
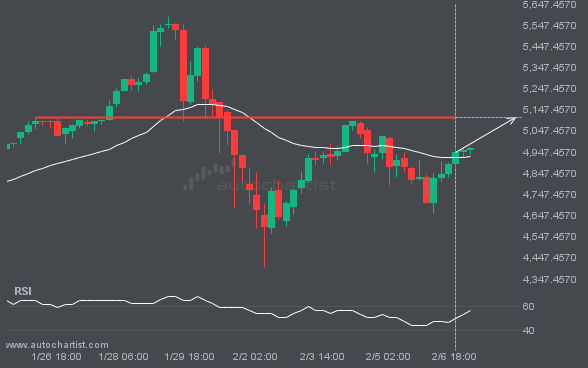
BRN/USD is moving toward a resistance line. Since it has retraced from this line before, we may see either a breakout through it or a rebound to current levels. It has touched this line multiple times in the past 8 days and may test it again within the next 2 days.
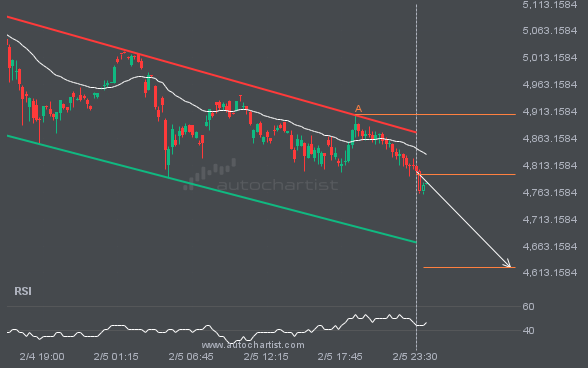
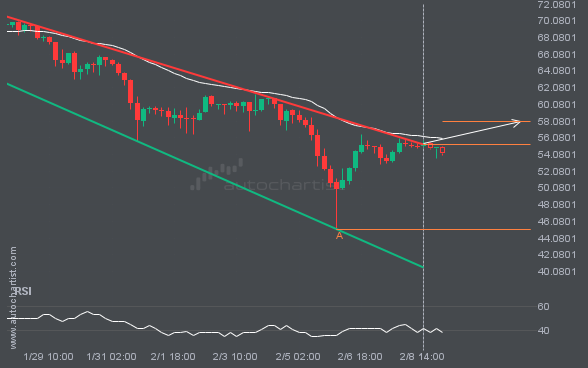
XAUUSD is trapped in a Channel Down formation, implying that a breakout is imminent. This is a strong trade setup for both trend and swing traders. It is now approaching a resistance line that has been tested before. Divergence watchers may be optimistic about a potential breakout, which could mark the start of a new […]