Daily Top Trade Setups: Advanced Forex, Indices, Commodities, and Stock Analysis
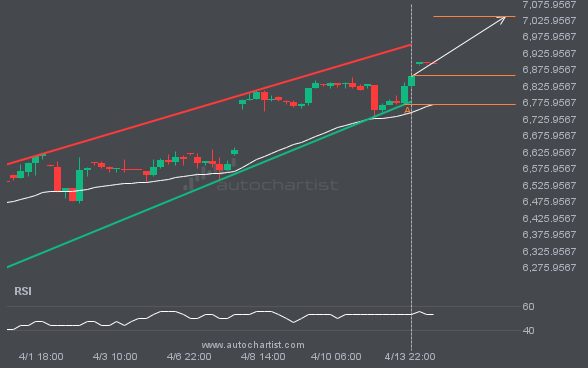
After repeatedly testing the resistance line, S&P500 is once again approaching it. Can we expect a bullish trend to emerge?
S&P500 is heading toward the resistance line of a Channel Up pattern and could reach it within the next 3 days. It has tested this line numerous times before, and this time may be no different, ending in a rebound instead of a breakout. If a breakout doesn’t occur, we could see a retracement back […]
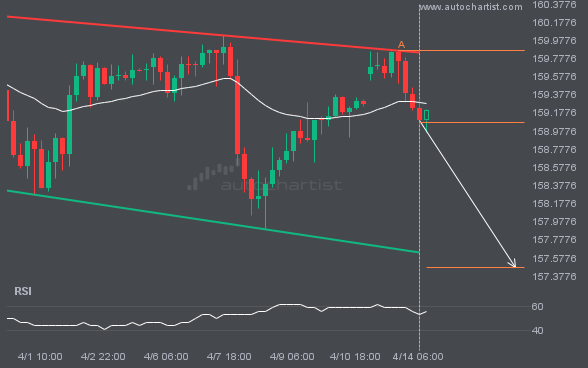
USDJPY is approaching a support line of a Channel Down. It has touched this line numerous times in the last 16 days.
USDJPY was identified around 159.0765 after recently rebounding off the resistance on the 4 hour interval. Ultimately, the stock’s price action has formed a Channel Down pattern. This squeeze may increase the chances of a strong breakout. The projected move could take the price to around 157.4746.
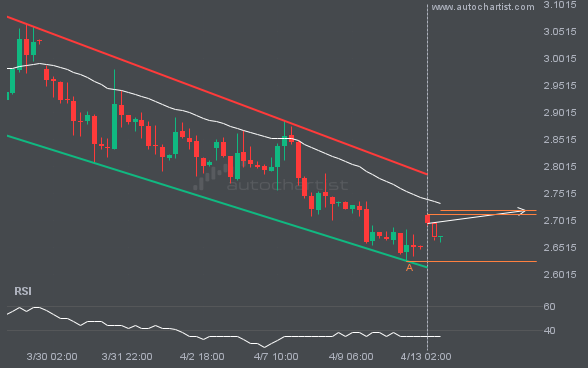
An important resistance line is being approached by NGC/USD. This price has been tested numerous times in the last 20 days
NGC/USD is moving toward a resistance line. Since it has retraced from this line before, we may see either a breakout through it or a rebound to current levels. It has touched this line multiple times in the past 20 days and may test it again within the next 3 days.
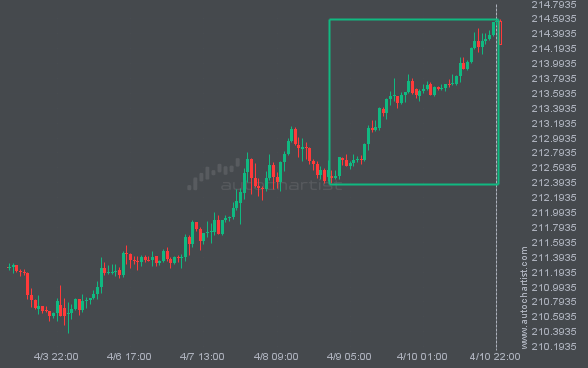
An unusually large move was recorded for GBPJPY. The magnitude of the move is exceptional.
GBPJPY reached 214.562 after a 0.99% move spanning 2 days.
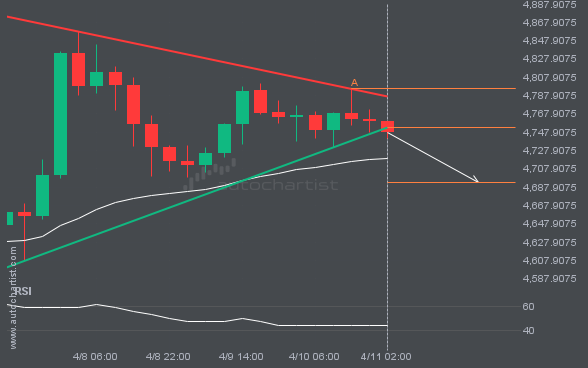
A breach of support could signal the start of a bearish trend for XAUUSD.
This trade setup on XAUUSD formed after a period of consolidation, during which the price moved mostly sideways before choosing a longer-term direction. Following the bearish breakout through support, the price could move toward 4693.5120.
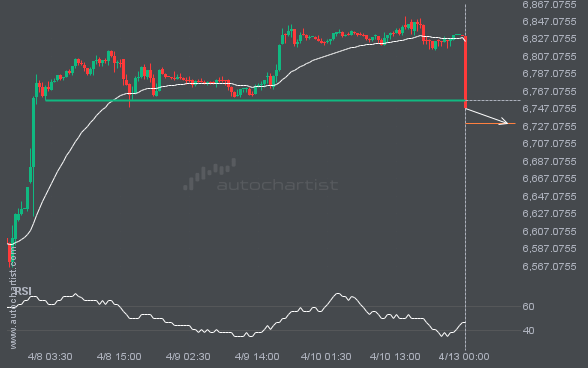
An important price level has been breached by S&P500. This level has been tested numerous times before.
S&P500 has broken through 6756.2100, which it has tested many times before. We have also seen it retrace from this level. If this new trend persists, S&P500 may be heading towards 6730.6089 within the next 3 days.
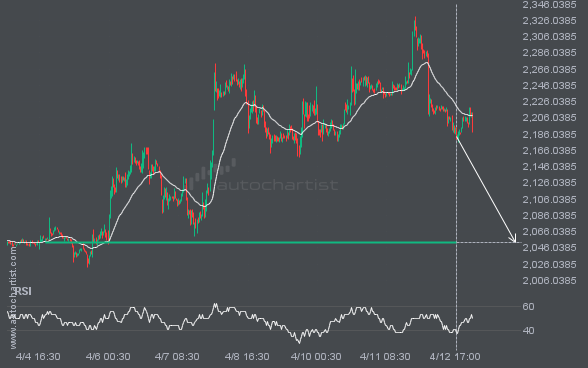
Will ETHUSD break through the support level it previously tested?
ETHUSD is approaching a support line at 2052.8701. If it hits the support line, it may break through this level to continue the bearish trend, or it may return to current levels.
Latest company news, corporate actions and partnership announcements
Interesting trading articles, ideas, and thought leadership
Ask your broker today or sign up for a demo from the Technical Analysis page.