Skip to content
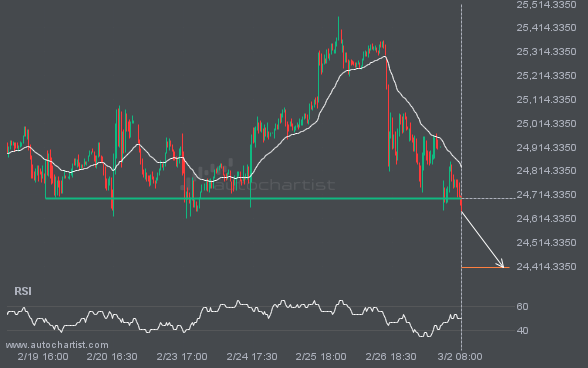
 The breakout of NAS100 through the 24699.4395 price line is a breach of an important psychological price level that it has tested numerous times in the past. If this breakout persists, NAS100 could test 24409.5957 within the next 2 days. One should always be cautious before placing a trade and wait for confirmation of the […]
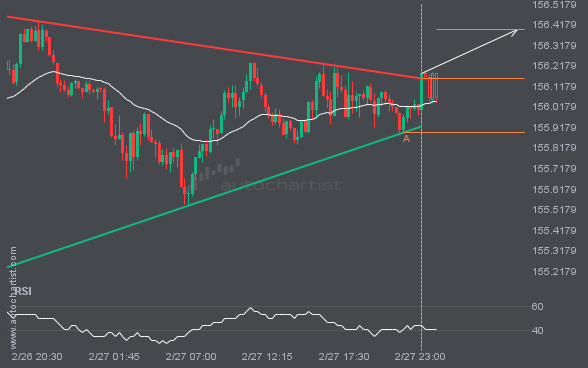
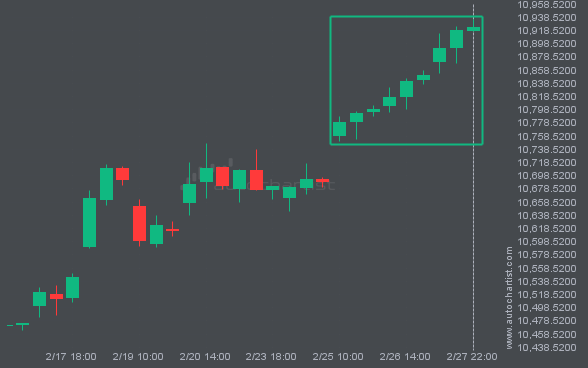
USDJPY has broken through a resistance line of the Triangle chart pattern. If this breakout holds, we may see the price of USDJPY test 156.3917 within the next 7 hours. But don’t rush to trade. It has tested this line before, so confirm the breakout before taking any action.
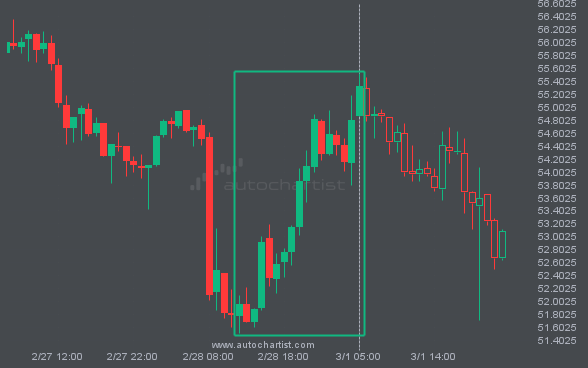
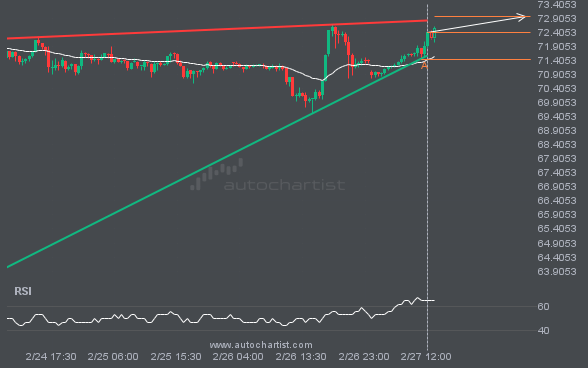
BRN/USD is moving toward a resistance line. Since it has retraced from this line before, we may see either a breakout through it or a rebound to current levels. It has touched this line multiple times in the past 2 days and may test it again within the next 5 hours.
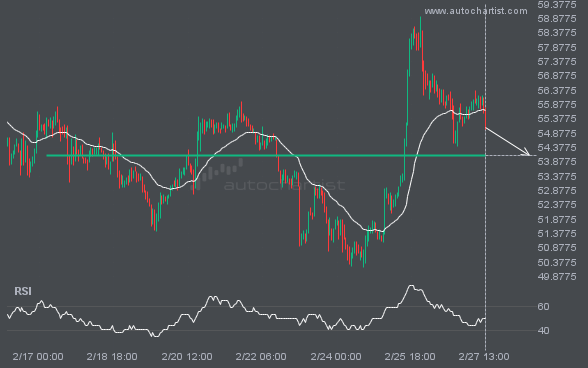
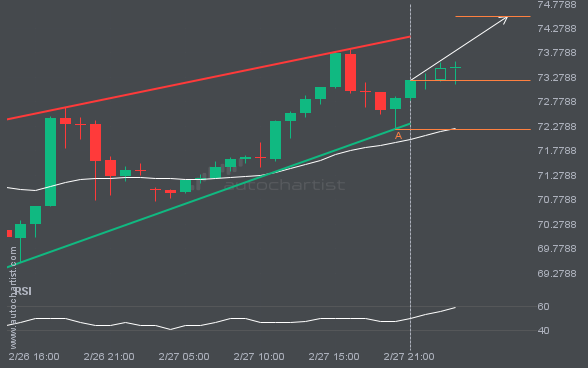
BRN/USD is trapped in a Rising Wedge formation, implying that a breakout is imminent. This is a strong trade setup for both trend and swing traders. It is now approaching a support line that has been tested before. Divergence watchers may be optimistic about a potential breakout, which could mark the start of a new […]