Skip to content
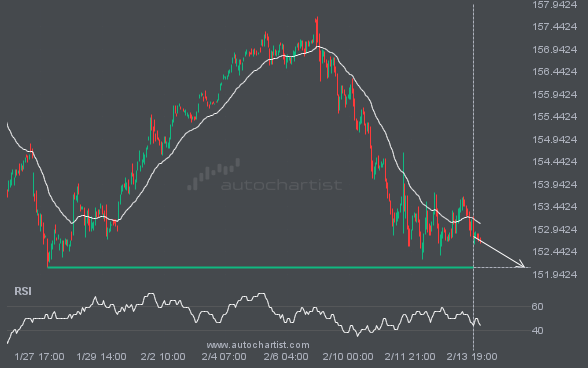
USDJPY is moving toward a support line. Because it has retraced from this level in the past, we may see either a breakout through this line or a rebound to current levels. It has touched this line multiple times over the last 17 days and may test it again within the next 3 days.
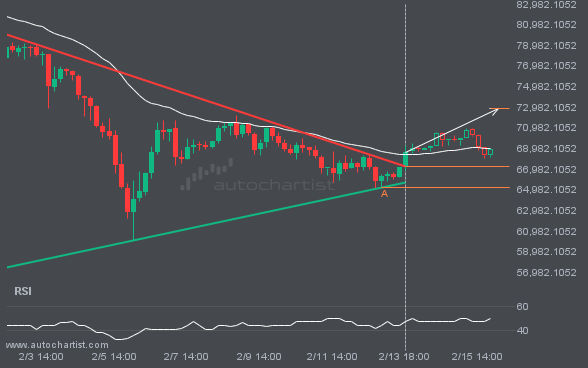
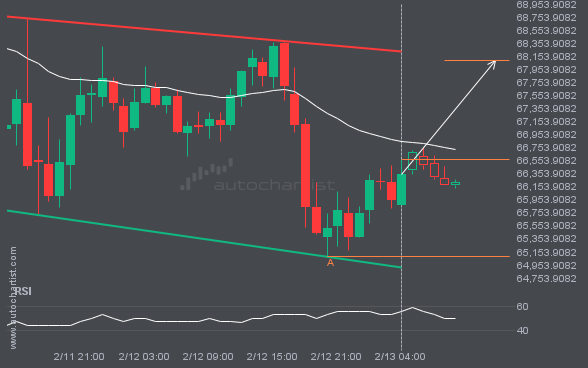
BTCUSD has broken through the resistance line of a Triangle technical chart pattern. Because it has retraced from this line in the past, you should wait for confirmation of the breakout before taking any action. It has touched this line twice in the last 15 days, suggesting a possible target level around 72868.7555 within the […]
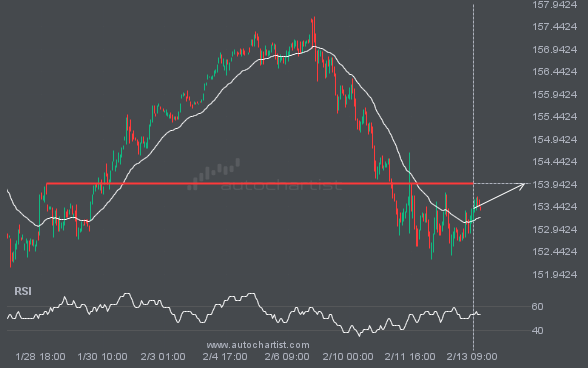
USDJPY is heading toward 153.9560 and could reach this level within the next 3 days. It has tested this level numerous times in the past, and this time could be no different, ending in a rebound rather than a breakout. If a breakout does not occur, we may see a retracement back to current levels.
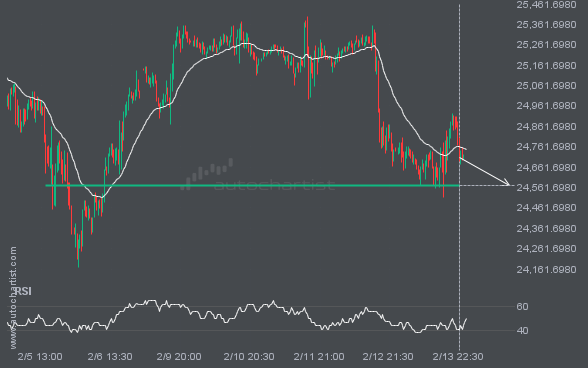
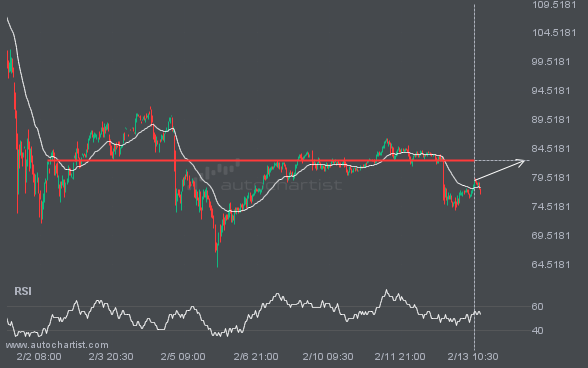
S&P500 is moving toward a support line. Since it has retraced from this line before, we may see either a breakout through it or a rebound to current levels. It has touched this line multiple times in the past 2 days and may test it again within the next 6 hours.
The price of XAGUSD is heading back toward the resistance area. It may struggle to break through and could reverse direction. The price may eventually break through, but it typically retreats from the level several times before doing so.
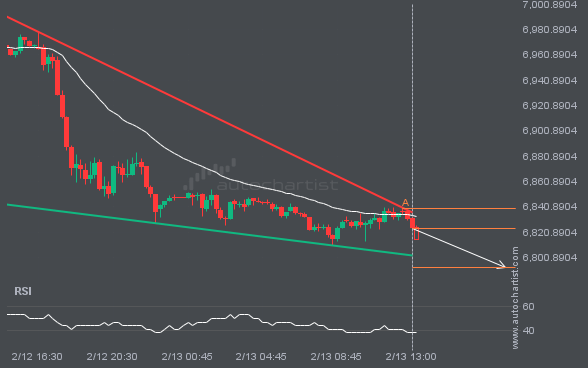
BTCUSD is heading toward the resistance line of a Channel Down pattern and could reach it within the next 6 hours. It has tested this line numerous times before, and this time may be no different, ending in a rebound instead of a breakout. If a breakout doesn’t occur, we could see a retracement back […]