Skip to content
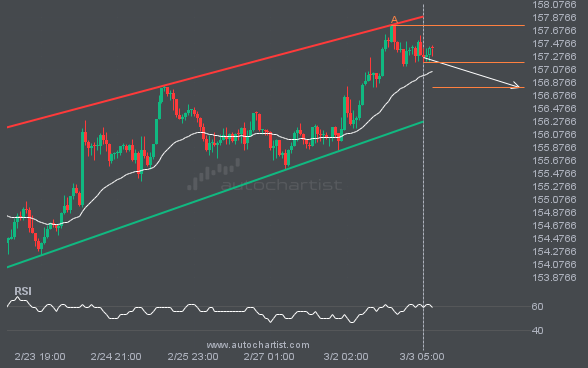
USDJPY is moving toward a support line it has tested many times. It has retraced from this line before, so it’s unclear whether it will break through or rebound again. If USDJPY continues on its current trajectory, it could reach 156.7928 within the next 2 days.
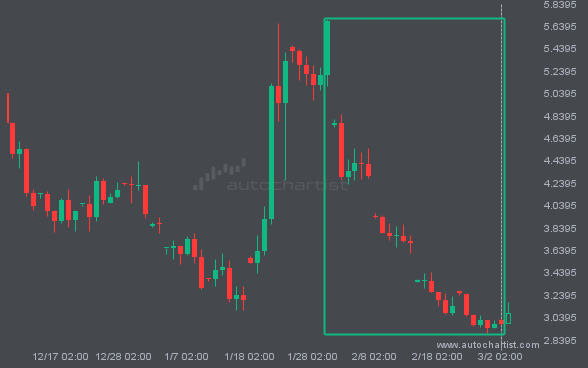
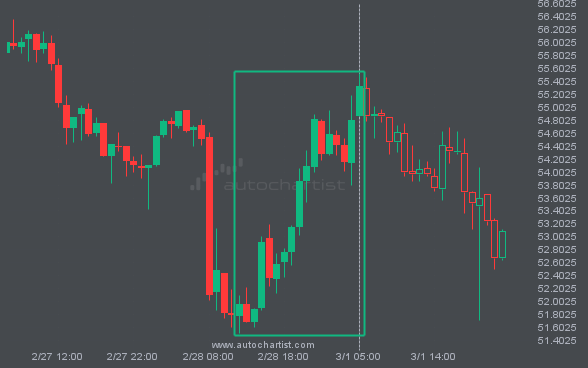
An emerging Rectangle pattern has been detected for LTCUSD on the 1 hour chart. There may be a move toward 52.0100 in the next few candles. Once it reaches the support, it may continue its bearish run or revert to current price levels.
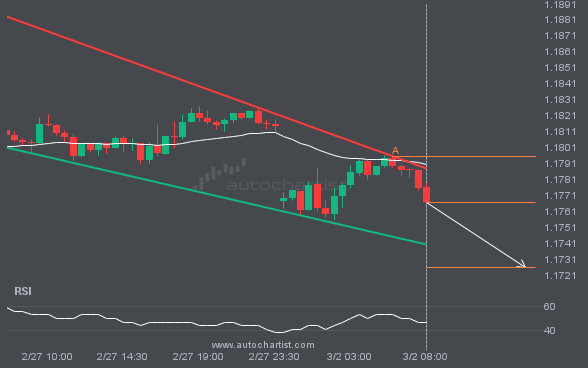
EURUSD is heading toward the support line in a Falling Wedge pattern. If this move continues, the price of EURUSD could test 1.1726 within the next 7 hours. It has tested this line many times before, so the move could be short-lived and may rebound as it has before.
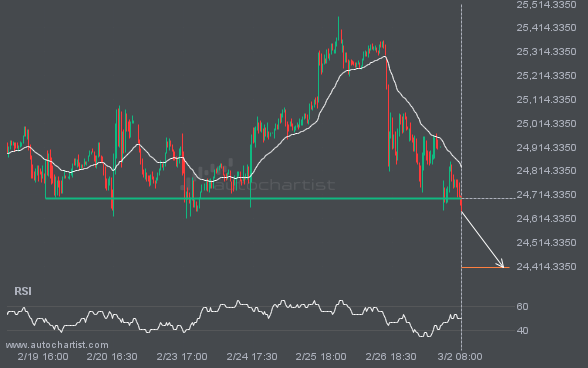
The breakout of NAS100 through the 24699.4395 price line is a breach of an important psychological price level that it has tested numerous times in the past. If this breakout persists, NAS100 could test 24409.5957 within the next 2 days. One should always be cautious before placing a trade and wait for confirmation of the […]
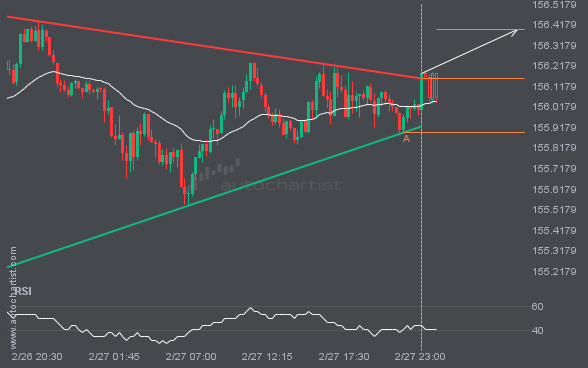
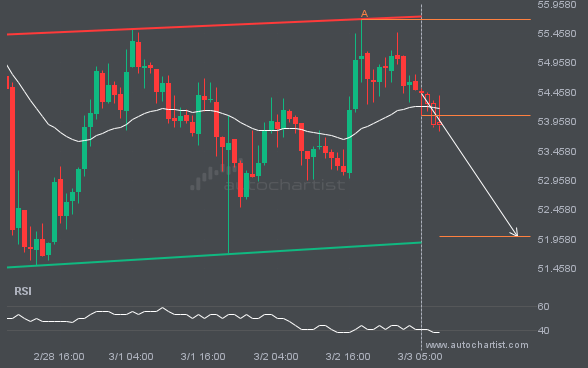
USDJPY has broken through a resistance line of the Triangle chart pattern. If this breakout holds, we may see the price of USDJPY test 156.3917 within the next 7 hours. But don’t rush to trade. It has tested this line before, so confirm the breakout before taking any action.
By Laurence Fish, Developer, Autochartist.com Price data is central to our business in the drawing of the charts and the
By Robain Polly, Product Evangelist and Resident Snake Charmer, Autochartist.com I collect venomous snakes as a hobby; my collection includes adders, vipers and cobras. I spend hours studying and looking after them. I have often decided to quit, and a few weeks later I find myself getting new snakes just because they are pretty or […]
By Jingwei Li, Researcher, Autochartist.com Some brokers simply take the position of “take on as much risk as possible and therefore maximize profitability”, while others assume a more moderate approach of balancing the liquidity of their company with profitability. In this short article we investigate the use of a sentiment-based indicator to assist brokers in […]

Autochartist is proud to announce that it has concluded the acquisition of a controlling stake in Delkos Research (www.delkos.com) – a company providing forecasts and content for Futures and Forex brokers based around macro-economic news events. This is the second acquisition that Autochartist has concluded in 2018. Delkos’s News Events Trading Services (NETS) allows traders to […]