Daily Top Trade Setups: Advanced Forex, Indices, Commodities, and Stock Analysis
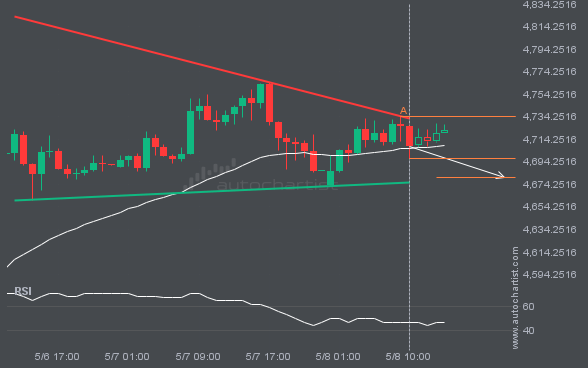
XAUUSD is approaching the support line of a Triangle pattern. We anticipate either a breakout through this line or a rebound.
An emerging Triangle pattern in its final wave has been identified on the XAUUSD 1 hour chart. After a strong bearish run, XAUUSD is heading toward the upper triangle trendline, with possible resistance at 4680.1062. If the support holds, the Triangle pattern suggests a rebound toward current levels.
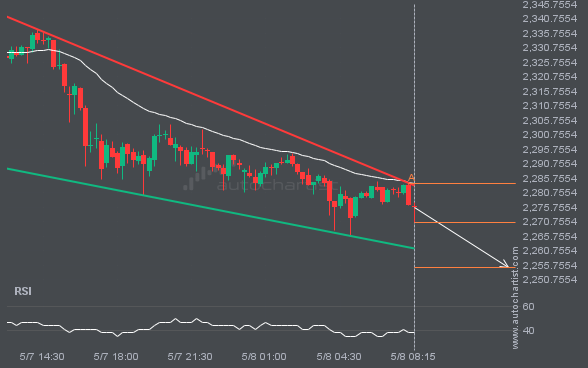
ETHUSD is approaching a support line of a Falling Wedge. It has touched this line numerous times in the last 19 hours.
A Falling Wedge pattern was identified for ETHUSD at 2270.46, suggesting it may move toward the support line at 2255.0476. It may break through that line and continue the bearish trend, or reverse from it.
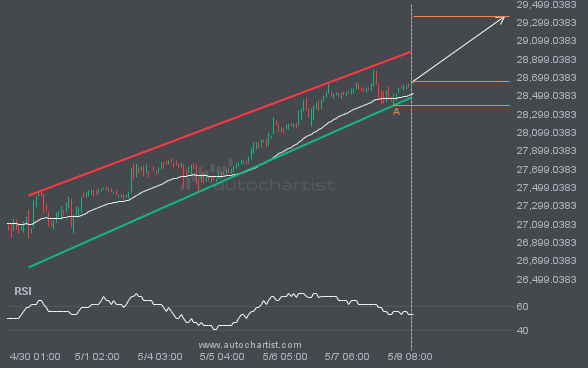
Consider a move on NAS100 as it heads toward resistance.
NAS100 is heading toward the resistance line in a Channel Up pattern. If this move continues, the price of NAS100 could test 29362.2249 within the next 3 days. It has tested this line many times before, so the move could be short-lived and may rebound as it has before.
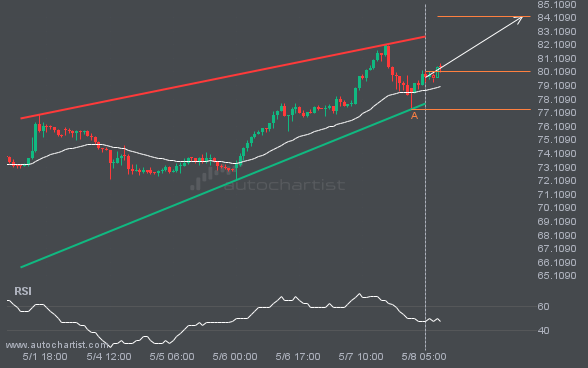
XAGUSD is signaling a possible trend reversal on intraday charts, as the price fails to breach support.
XAGUSD is moving toward a resistance line. Since it has retraced from this line before, we may see either a breakout through this line or a rebound to current levels. It has touched this line numerous times in the last 7 days and may test it again within the next 2 days.
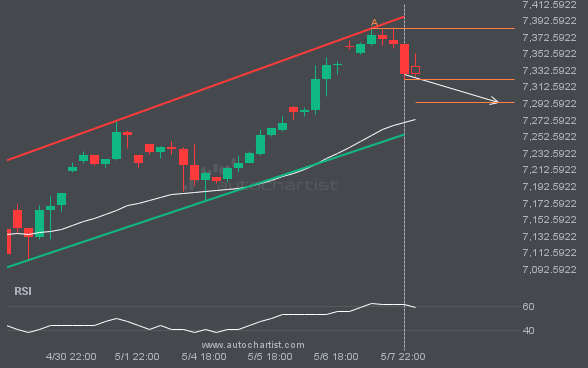
S&P500 is approaching the support line of a Channel Up pattern. We anticipate either a breakout through this line or a rebound.
S&P500 is moving toward a support line. Since it has retraced from this line before, we may see either a breakout through this line or a rebound to current levels. It has touched this line numerous times in the last 9 days and may test it again within the next 2 days.
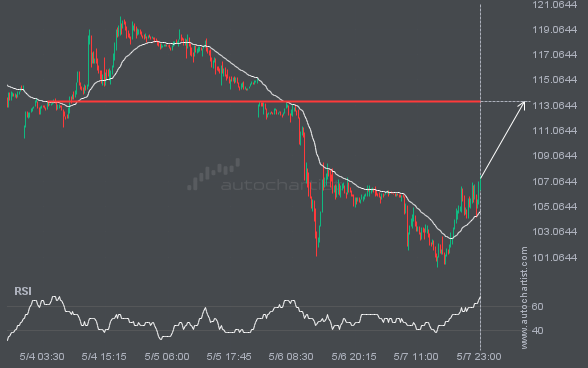
BRN/USD is heading toward a price it has tested 3 times recently.
A strong resistance level has been identified at 113.3880 on the 15 Minutes BRN/USD chart. BRN/USD is likely to test this level soon.
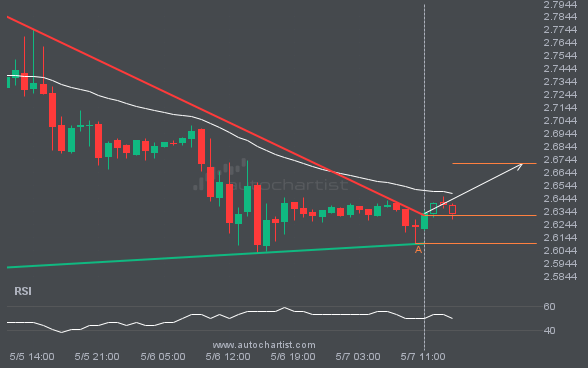
Resistance line has been breached by NGC/USD. This price level has been tested at least twice before.
The last 3 1 hour candles on NGC/USD have formed a Triangle pattern and broken out through the pattern lines, indicating a possible bullish movement toward the price level at 2.6716.
Latest company news, corporate actions and partnership announcements
Autochartist, a world-renowned technology partner that provides real-time financial market analysis, has been recognized as the “Most Comprehensive Market Analysis Provider” by
Autochartist and Swissquote have recently embarked on an impressive collaboration in which Autochartist’s Advanced Technical Analysis has been deeply integrated into their proprietary trading platform, “Advanced Trader”. This integration creates an intuitive experience for their extensive client base of global CFD traders. One of the standout features of this integration is the ability to execute […]
Today we spotlight a new Autochartist code library developed exclusively for brokers. This product creates a synergistic relationship between Autochartist, TradingView charts, and Broker platforms. Autochartist is a global leader in technical analysis for financial markets, and through its partnership with brokers around the world, it serves millions of traders in over 100 countries by providing analysis […]
I’m excited to have the opportunity to speak with you today about your experience as the head of customer training at Autochartist. To begin, can you tell me about your experience working at Autochartist? What has been the most rewarding aspect of your role, and what have been some of the biggest challenges you’ve faced? […]
Global Trade Capital Limited (GTCFX) – a leading online brokerage house, has announced its implementation of cutting-edge data analytics solutions from Autochartist, a trusted leader in automated financial market analysis. GTCFX has chosen Autochartist for its trusted reputation in the fintech brokerage industry. The partnership will allow GTCFX to offer award-winning decision-making tools to their […]
Autochartist, a world-renowned technology partner that provides real-time market analysis for traders, was named “Most Comprehensive Market Analysis Provider – Global” by the ForexRating.com Awards 2022. This award specifically highlights excellence in investment analytics solutions for financial markets and recognizes vendors providing exceptional and innovative infrastructure, technology, and data solutions. Autochartist provides a broad range […]
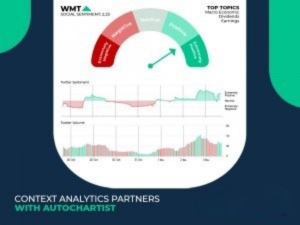
Context Analytics (CA), a global leader in Unstructured Financial Data processing has partnered with Autochartist to distribute its social media sentiment analysis tool into Europe, the United Kingdom, and APAC. Context Analytics (CA), a global leader in Unstructured Financial Data processing has partnered with Autochartist to distribute its social media sentiment analysis tool into Europe, the United […]
By Rhonda Truter, To date, the Autochartist suite of products is available in 28 languages, 10 of which have been added over the past 4 years. I will share how exactly we have accomplished this and what difficulties we have faced along the way. If you’re about to embark on a multi-language development project I […]
The future of the financial industry is changing fast with the ever increasing use of social media platforms. The impact of social media combined with big data has opened up new opportunities for stock brokers, futures brokers and forex brokers; not only to enhance their communication with clients but to also increase their exposure, brand […]
By Ilan Azbel, CEO, Autochartist. I would say that I’m a pretty confident public speaker; of course I’m not a professional, but put me on a stage in front of a few hundred people and I’ll be happy to speak for hours. I love sharing knowledge, especially in my field of expertise. So when I […]
How to enhance your lead generation process and generate more business leads. 5 + 1 Tips to increase Lead-Acquisition for your Brokerage Fx brokers are continuously investing in improving their lead generation processes and how their lead funnels can be enhanced to achieve maximum results. Some of the most widely used tactics in the past were focused on added value via […]
By Kobus Steenekamp, CTO, Autochartist Don’t get me wrong, we love AWS, and we use a ton of great products from them, but when it comes to cost control, it can easily get out of hand. Case in point, AWS’s CloudWatch. Like any tech team, we are constantly under pressure to do more cool stuff, […]
In today’s fast paced online environment, the financial industry is always trying to keep up to date with the latest news. The concept of Natural Language Generation (NLG) is echoing strongly in the industry as Fx brokers are seeking new ways to reach a larger audience with the right message. But what is NLG? Natural language generation software uses […]