Skip to content
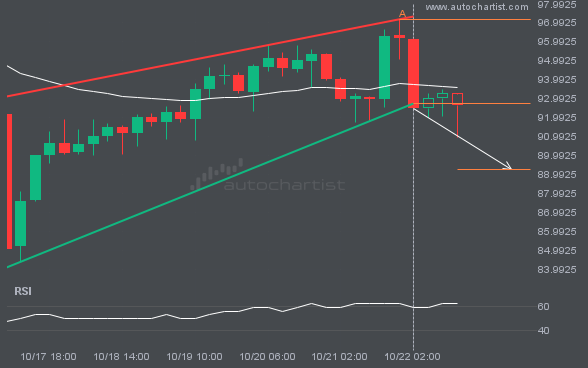
LTCUSD has broken through a support line of a Pennant and suggests a possible movement to 89.2287 within the next 20 hours. It has tested this line in the past, so one should probably wait for a confirmation of this breakout before taking action. If the breakout doesn’t confirm, we could see a retracement back […]
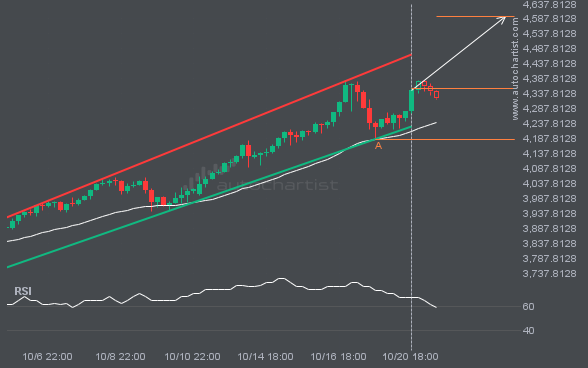
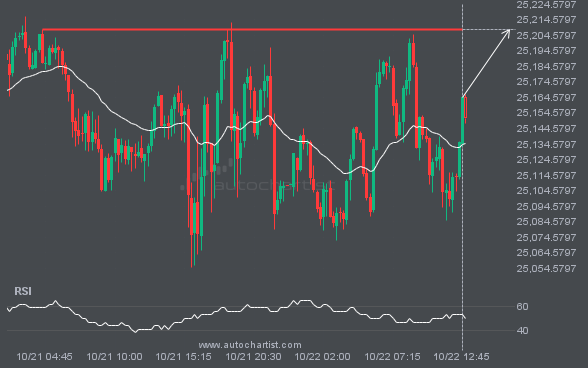
A Channel Up pattern was identified on XAUUSD at 4355.76, creating an expectation that it may move to the resistance line at 4595.8666. It may break through that line and continue the bullish trend or it may reverse from that line.
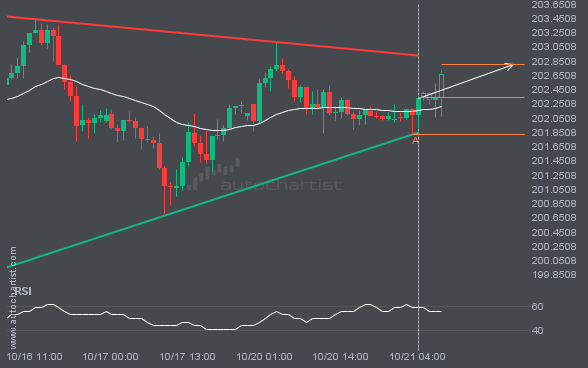
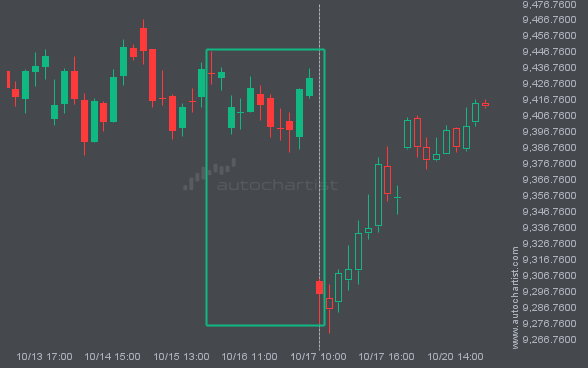
A Triangle pattern was identified on GBPJPY at 202.345, creating an expectation that it may move to the resistance line at 202.7974. It may break through that line and continue the bullish trend or it may reverse from that line.
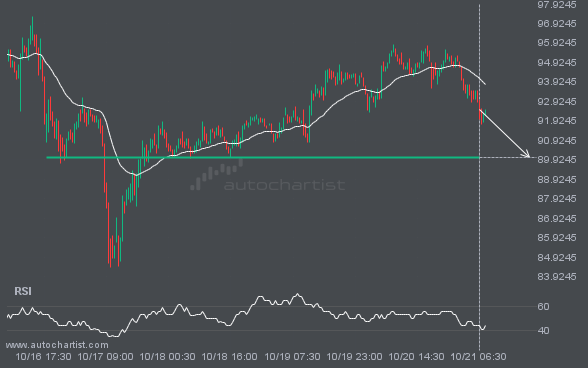
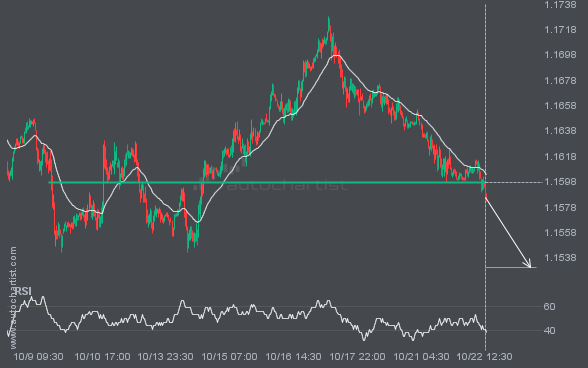
LTCUSD is about to retest a key horizontal support level near 90.0200. It has tested this level 5 times in the recent past and could simply bounce off like it did last time. However, after this many tries, maybe it’s ready to start a new trend.