Skip to content
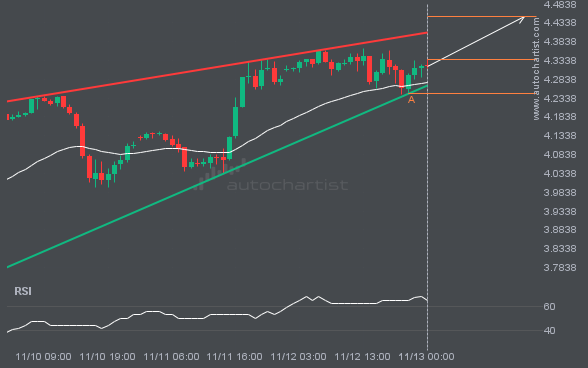
 NGC/USD is moving toward a resistance line it has tested many times. It has retraced from this line before, so it’s unclear whether it will break through or rebound again. If NGC/USD continues on its current trajectory, it could reach 4.4504 within the next 19 hours.
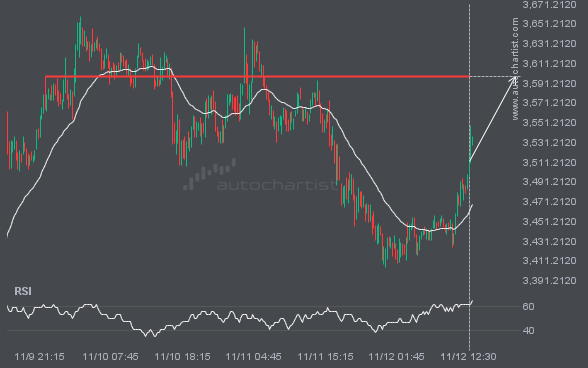
ETHUSD is approaching a critical level that could be a key deciding factor for what comes next. We may see this trajectory continue to test and break through 3597.8000, unless it loses momentum and pulls back to current levels.
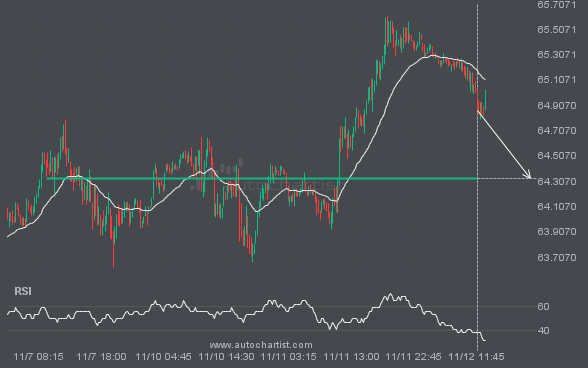
BRN/USD is heading toward 64.3305 and could reach this level within the next 15 hours. It has tested this level numerous times in the past, and this time could be no different, ending in a rebound rather than a breakout. If a breakout does not occur, we may see a retracement back to current levels.
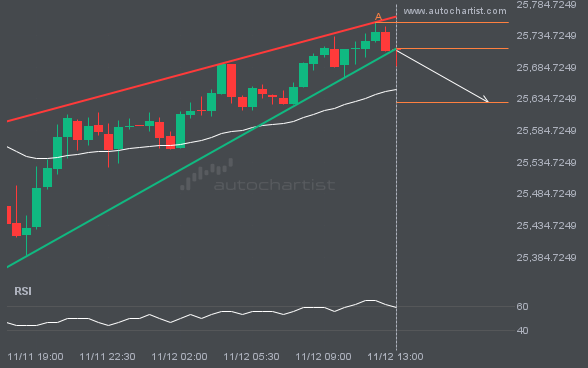
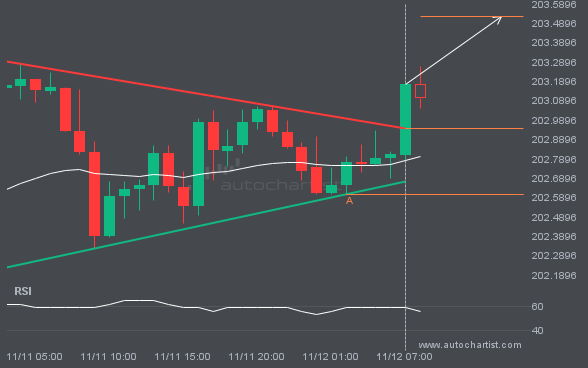
NAS100 has broken through a support line of the Rising Wedge chart pattern. If this breakout holds, we may see the price of NAS100 test 25629.1624 within the next 5 hours. But don’t rush to trade. It has tested this line before, so confirm the breakout before taking any action.
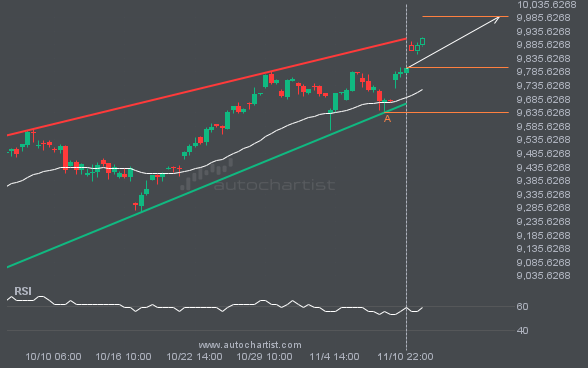
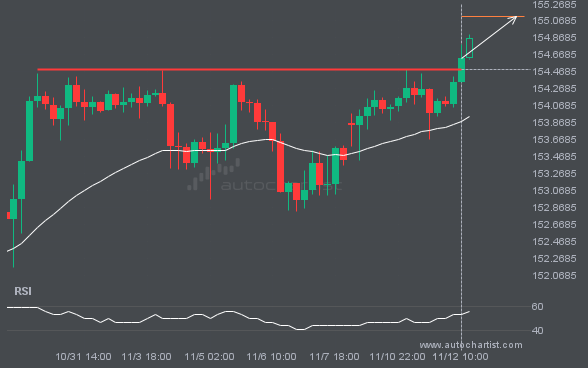
FTSE100 is moving toward a resistance line. Since it has retraced from this line before, we may see either a breakout through this line or a rebound to current levels. It has touched this line numerous times in the last 48 days and may test it again within the next 3 days.