Skip to content
 GBPJPY is heading toward the resistance line of a Channel Up pattern and could reach it within the next 3 days. It has tested this line numerous times before, and this time may be no different, ending in a rebound instead of a breakout. If a breakout doesn’t occur, we could see a retracement back […]
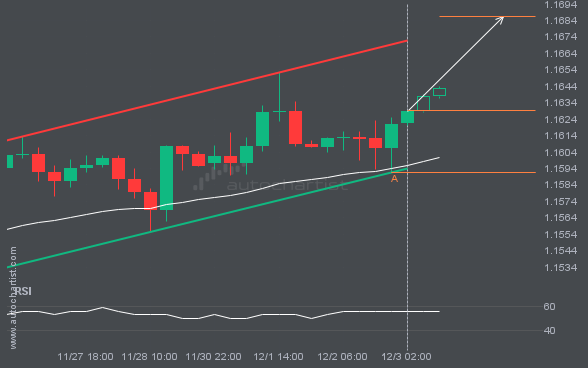
A Channel Up pattern was identified for EURUSD at 1.162915, suggesting it may move toward the resistance line at 1.1686. It may break through that line and continue the bullish trend, or reverse from it.
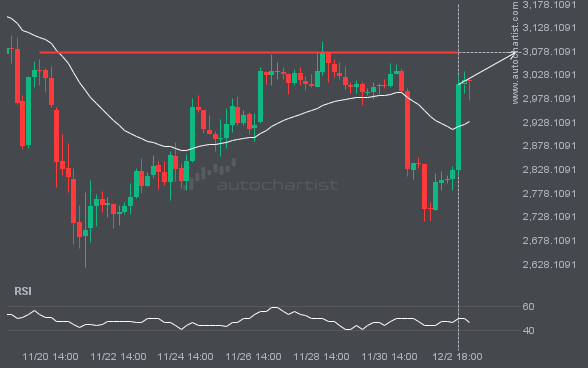
ETHUSD is heading toward 3075.0200 and could reach this level within the next 3 days. It has tested this level numerous times in the past, and this time could be no different, ending in a rebound rather than a breakout. If a breakout does not occur, we may see a retracement back to current levels.
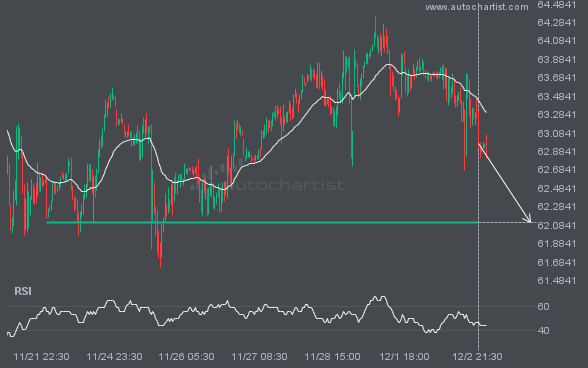
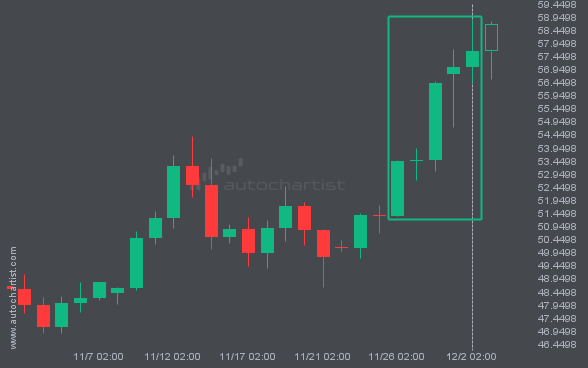
BRN/USD is heading toward 62.1120 and could reach this level within the next 2 days. It has tested this level numerous times in the past, and this time could be no different, ending in a rebound rather than a breakout. If a breakout does not occur, we may see a retracement back to current levels.
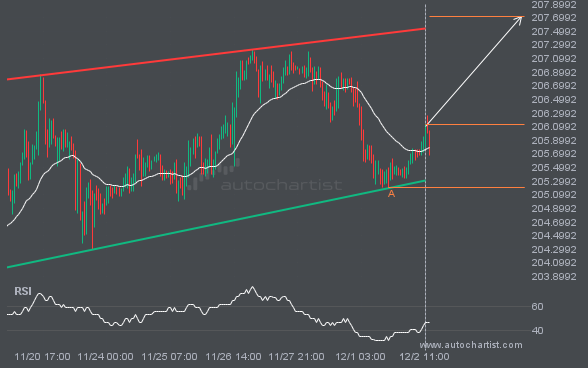
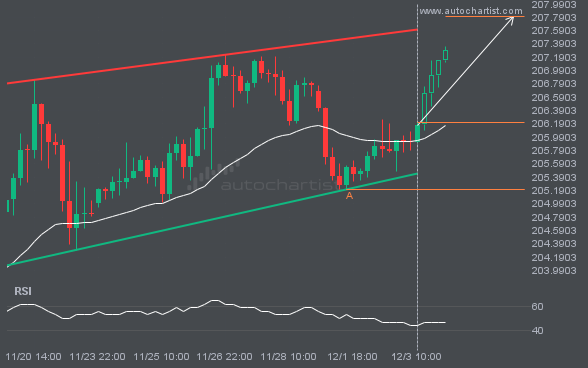
GBPJPY is moving toward a resistance line it has tested many times. It has retraced from this line before, so it’s unclear whether it will break through or rebound again. If GBPJPY continues on its current trajectory, it could reach 207.7151 within the next 3 days.
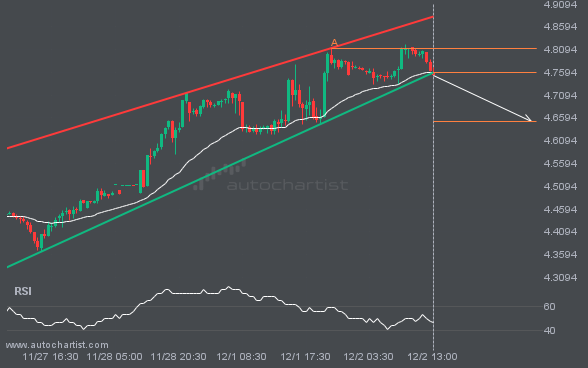
This trade setup on NGC/USD formed after a period of consolidation, during which the price moved mostly sideways before choosing a longer-term direction. Following the bearish breakout through support, the price could move toward 4.6522.