Skip to content
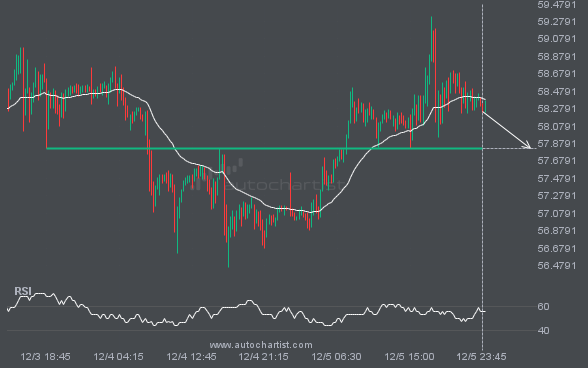
 XAGUSD is approaching a critical level that could be a key deciding factor for what comes next. We may see this trajectory continue to test and break through 57.8255, unless it loses momentum and pulls back to current levels.
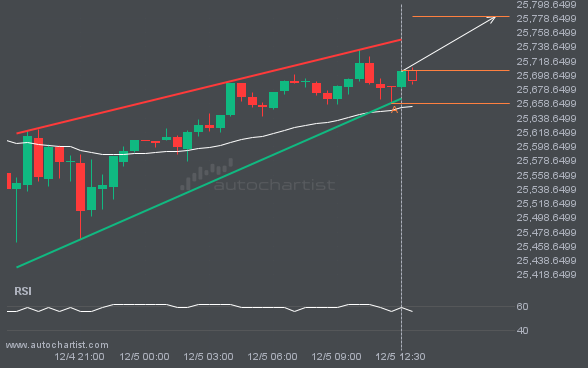
BRN/USD is moving toward a resistance line. Since it has retraced from this line before, we may see either a breakout through this line or a rebound to current levels. It has touched this line numerous times in the last 3 days and may test it again within the next 12 hours.
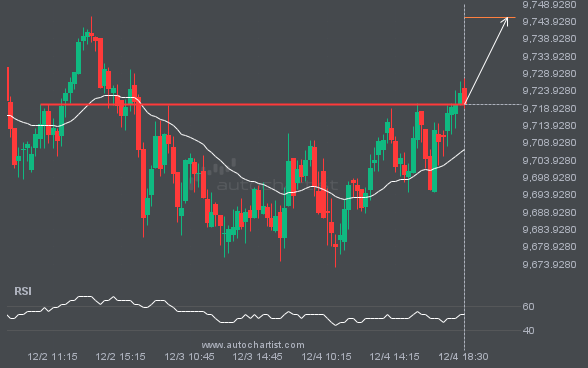
NAS100 is moving toward a resistance line it has tested many times. It has retraced from this line before, so it’s unclear whether it will break through or rebound again. If NAS100 continues on its current trajectory, it could reach 25781.0429 within the next 5 hours.
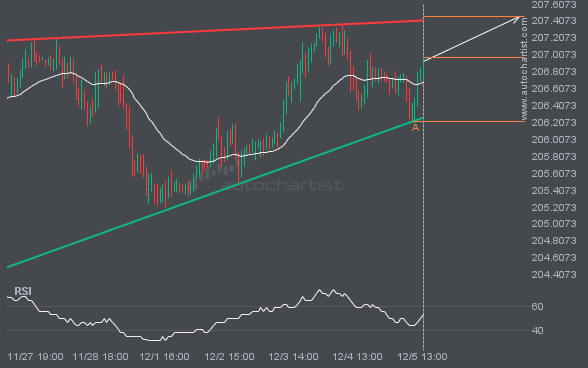
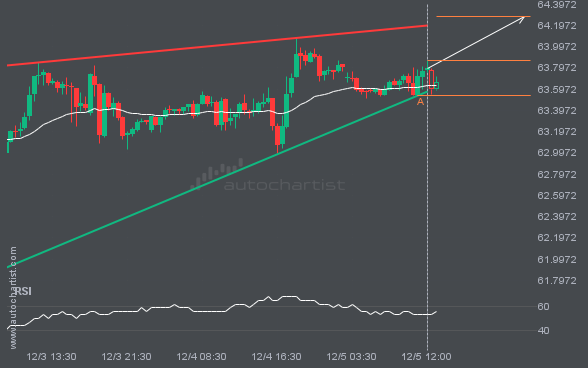
GBPJPY is heading toward the resistance line of a Rising Wedge pattern and could reach it within the next 2 days. It has tested this line numerous times before, and this time may be no different, ending in a rebound instead of a breakout. If a breakout doesn’t occur, we could see a retracement back […]
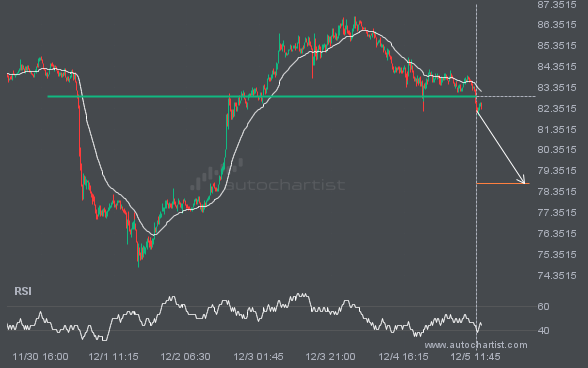
LTCUSD has broken through a support line. Since it has previously retraced from this price, wait for confirmation of the breakout before trading. It has touched this line several times over the past 5 days. This suggests a possible target around 78.7240 within the next 2 days.
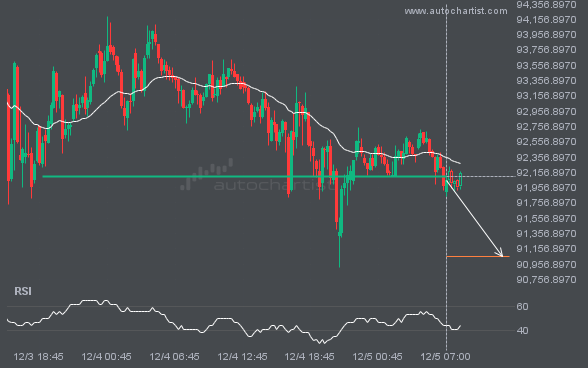
BTCUSD has broken through a support line. Since it has previously retraced from this price, wait for confirmation of the breakout before trading. It has touched this line several times over the past 2 days. This suggests a possible target around 91051.9922 within the next 7 hours.