Daily Top Trade Setups: Advanced Forex, Indices, Commodities, and Stock Analysis
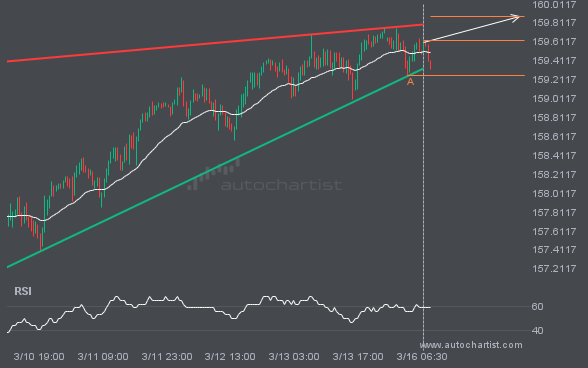
USDJPY is signaling a possible trend reversal on intraday charts, as the price fails to breach support.
USDJPY is trapped in a Rising Wedge formation, implying that a breakout is imminent. This is a strong trade setup for both trend and swing traders. It is now approaching a support line that has been tested before. Divergence watchers may be optimistic about a potential breakout, which could mark the start of a new […]
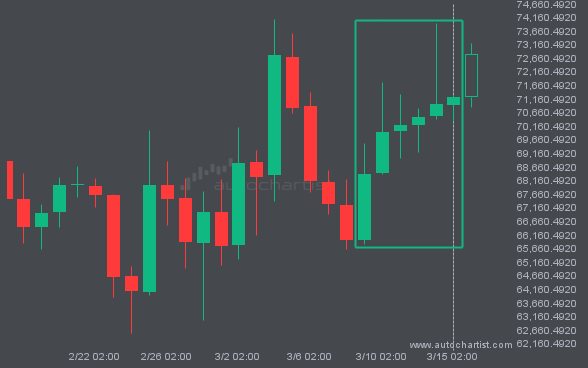
BTCUSD moves higher to 71214.9900 over the last 7 days.
BTCUSD saw a large number of bullish candles that reached 71214.9900 over 7 days.
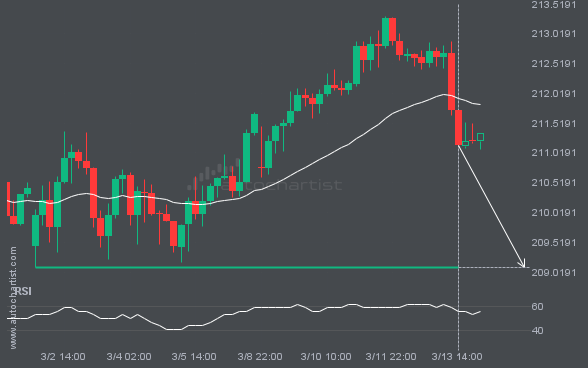
Will GBPJPY break through the support level it previously tested?
The price of GBPJPY is heading back toward the support area. It may struggle to break through and could reverse direction. The price may eventually break through, but it typically retreats from the level several times before doing so.
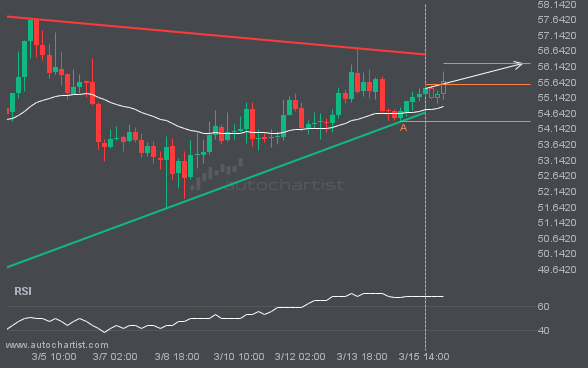
LTCUSD is approaching the resistance line of a Triangle pattern. We anticipate either a breakout through this line or a rebound.
A Triangle pattern was identified for LTCUSD at 55.57, suggesting it may move toward the resistance line at 56.2264. It may break through that line and continue the bullish trend, or reverse from it.
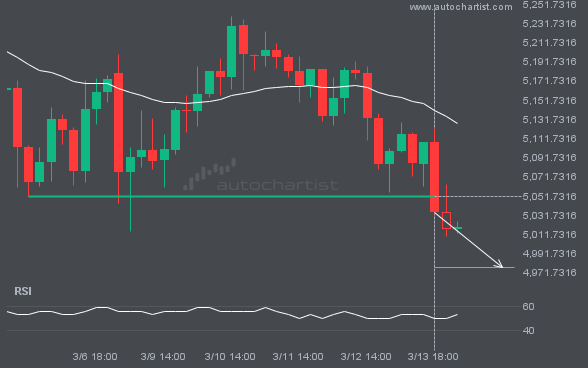
After numerous attempts, XAUUSD finally breaks through 5051.0151!
XAUUSD has broken through a support line. Because it has previously retraced from this price, you should wait for confirmation of the breakout before trading. It has touched this line multiple times over the past 9 days, which suggests a possible target around 4977.4375 within the next 2 days.
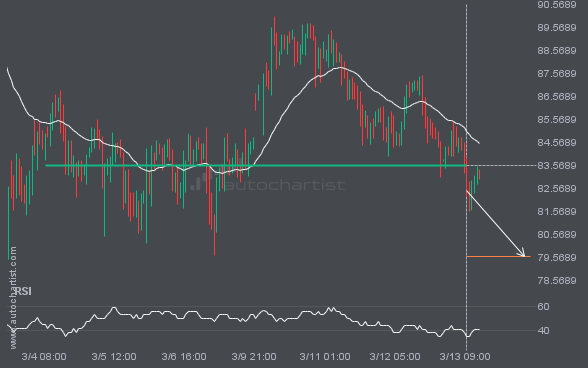
XAGUSD has broken through a level it has tested 4 times recently.
XAGUSD has broken through a line at 83.5743. If this breakout holds, we could see the price of XAGUSD move toward 79.6348 within the next 2 days. However, don’t be too quick to trade. It has tested this line many times in the past, so confirm the breakout before placing any trades.
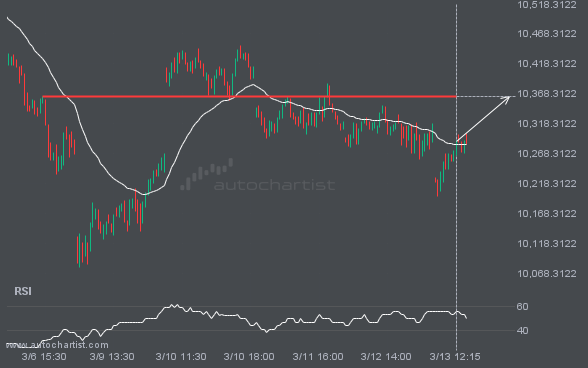
FTSE100 is heading toward a price it has tested 4 times recently.
FTSE100 is approaching a resistance line at 10363.5498. If it hits the resistance line, it may break through this level to continue the bullish trend, or it may return to current levels.
Latest company news, corporate actions and partnership announcements
Interesting trading articles, ideas, and thought leadership
Ask your broker today or sign up for a demo from the Technical Analysis page.