Daily Top Trade Setups: Advanced Forex, Indices, Commodities, and Stock Analysis
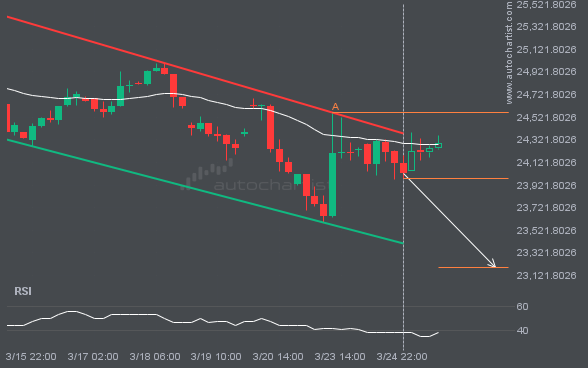
After repeatedly testing the support line, NAS100 is once again approaching it. Can we expect a bearish trend to emerge?
An emerging Channel Down pattern has been detected for NAS100 on the 4 hour chart. There may be a move toward 23193.4483 in the next few candles. Once it reaches the support, it may continue its bearish run or revert to current price levels.
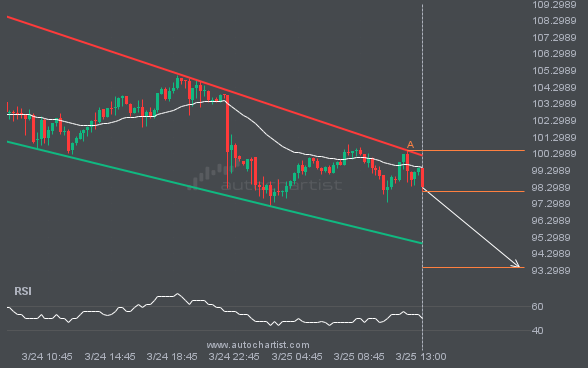
Consider a move on BRN/USD as it heads toward support.
BRN/USD is moving toward a support line. Since it has retraced from this line before, we may see either a breakout through it or a rebound to current levels. It has touched this line multiple times in the past 2 days and may test it again within the next 8 hours.
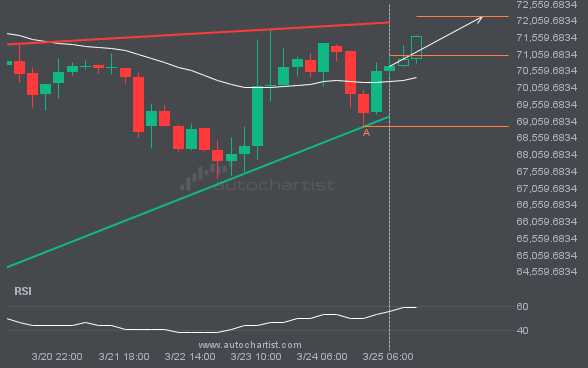
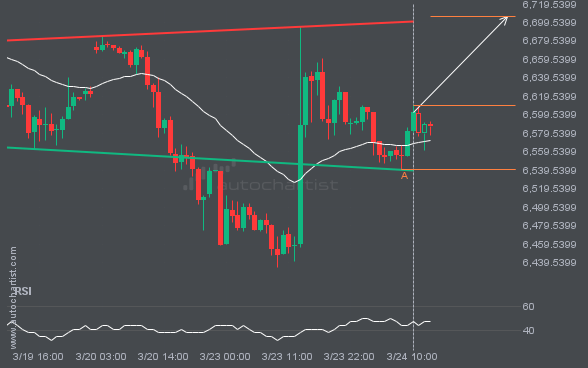
Consider a move on BTCUSD as it heads toward resistance.
BTCUSD is heading toward the resistance line of a Rising Wedge pattern and could reach it within the next 2 days. It has tested this line numerous times before, and this time may be no different, ending in a rebound instead of a breakout. If a breakout doesn’t occur, we could see a retracement back […]
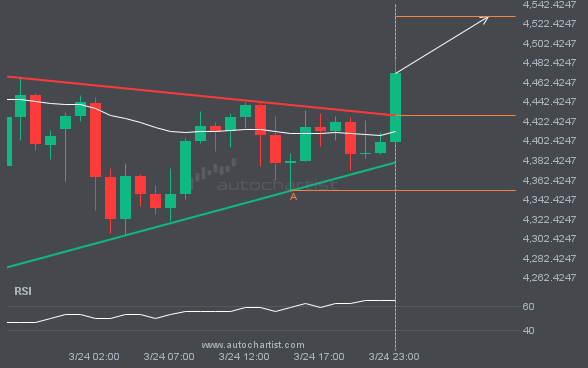
XAUUSD: breach of a resistance trendline that has been tested at least twice.
XAUUSD has broken through the resistance line of a Triangle technical chart pattern. Because it has retraced from this line in the past, you should wait for confirmation of the breakout before taking any action. It has touched this line twice in the last 2 days, which suggests a possible target around 4529.5972 within the […]
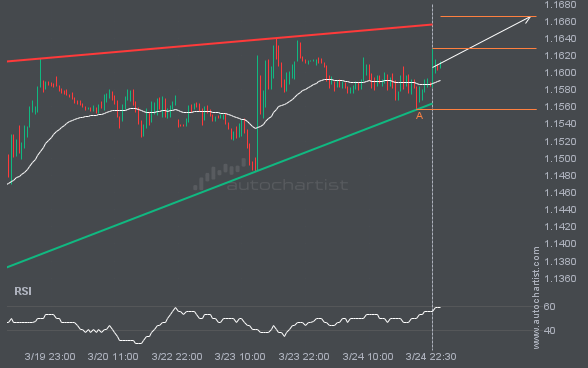
Because EURUSD has formed a Rising Wedge pattern, we expect it to touch the resistance line. If it breaks through the resistance, it may move much higher.
EURUSD is moving toward a resistance line it has tested many times. It has retraced from this line before, so it’s unclear whether it will break through or rebound again. If EURUSD continues on its current trajectory, it could reach 1.1665 within the next 22 hours.
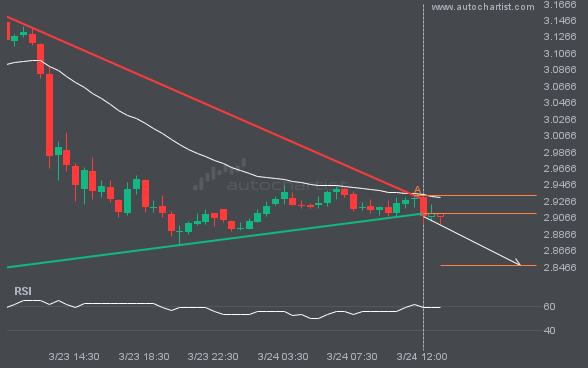
There may be a significant move in NGC/USD following a breach of support.
NGC/USD has broken through the support line of a Triangle pattern and suggests a possible move to 2.8486 within the next 6 hours. It has tested this line before, so it is prudent to wait for confirmation of the breakout before taking action. If the breakout is not confirmed, we could see a retracement back […]
S&P500 is signaling a possible trend reversal on intraday charts, as the price fails to breach support.
S&P500 was identified around 6610.02 after recently rebounding off the support on the 1 hour interval. Ultimately, the stock’s price action has formed a Inverse Head and Shoulders pattern. This squeeze may increase the chances of a strong breakout. The projected move could take the price to around 6705.9685.
Latest company news, corporate actions and partnership announcements
Interesting trading articles, ideas, and thought leadership
Ask your broker today or sign up for a demo from the Technical Analysis page.