Skip to content
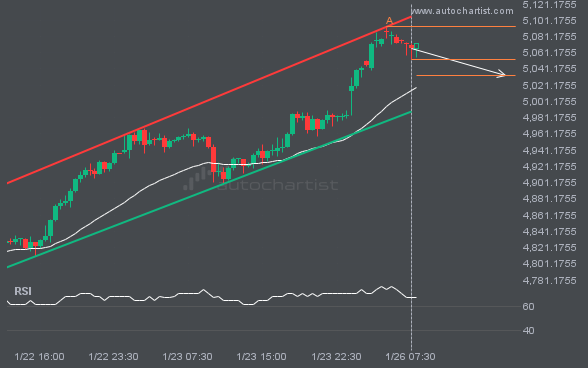
 ETHUSD is moving toward a resistance line. Since it has retraced from this line before, we may see either a breakout through it or a rebound to current levels. It has touched this line multiple times in the past 5 days and may test it again within the next 2 days.
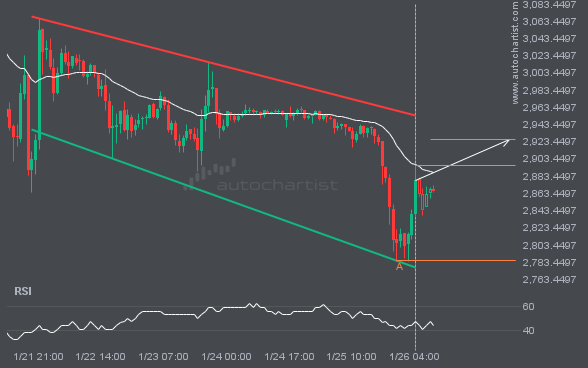
An emerging Channel Up has been detected on XAUUSD. The pattern has not yet broken through resistance, but the price is expected to move up over the next few hours. At the time the pattern was found, the price was 5052.465, and it is expected to move to 5033.3575.
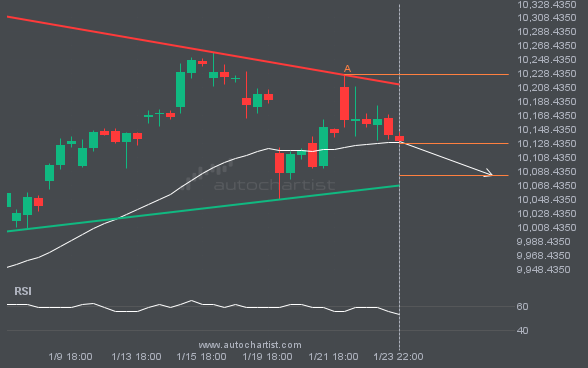
The movement of FTSE100 toward the support line of a Triangle is yet another test of the line it has reached numerous times in the past. This test of the line could occur within the next 2 days, but it is uncertain whether it will result in a breakout through this line or simply rebound […]
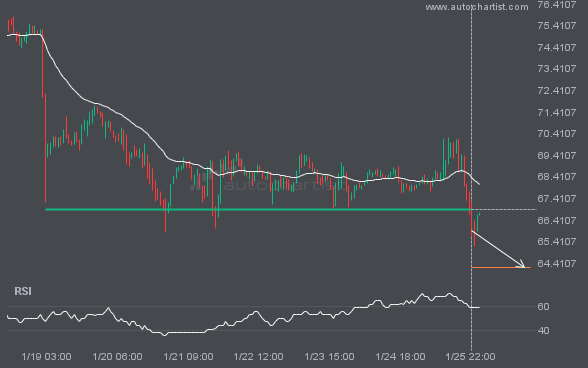
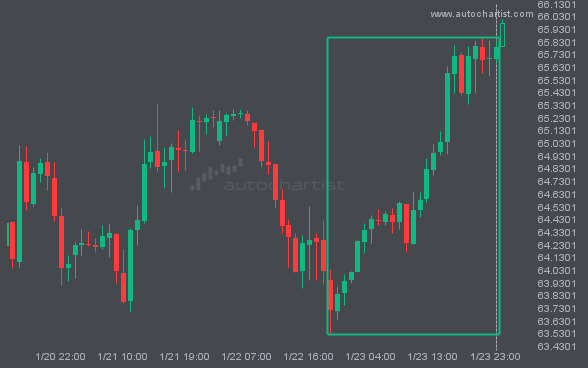
LTCUSD has broken through a support line. Since it has previously retraced from this price, wait for confirmation of the breakout before trading. It has touched this line several times over the past 7 days. This suggests a possible target around 64.2160 within the next 2 days.
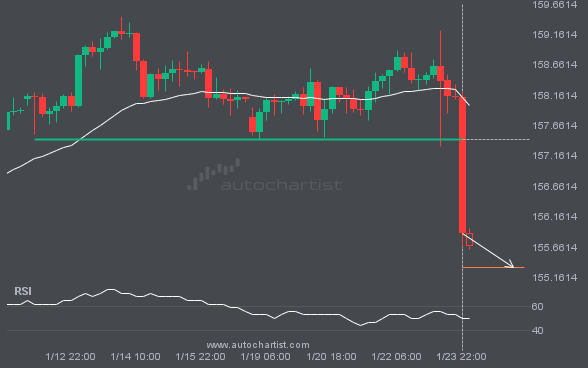
USDJPY has broken through a support line. Because it has previously retraced from this price, you should wait for confirmation of the breakout before trading. It has touched this line multiple times over the past 12 days, which suggests a possible target around 155.3263 within the next 3 days.
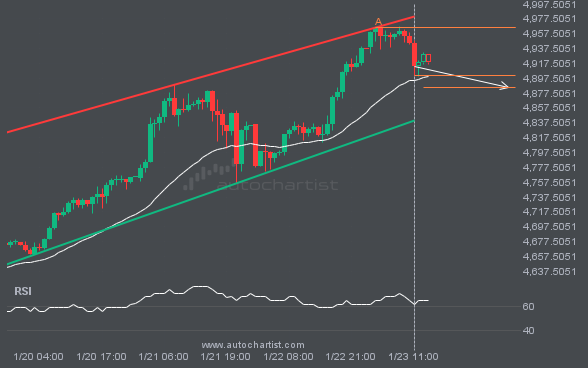
An emerging Channel Up pattern in its final wave has been identified on the XAUUSD 1 hour chart. After a strong bearish run, XAUUSD is heading toward the upper triangle trendline, with possible resistance at 4885.6165. If the support holds, the Channel Up pattern suggests a rebound toward current levels.