Skip to content
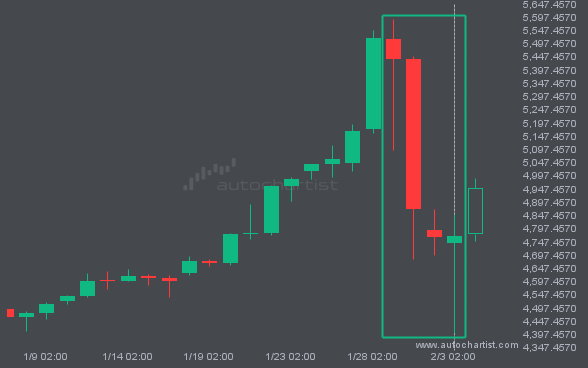
 BTCUSD is trapped in a Falling Wedge formation, implying that a breakout is imminent. This is a strong trade setup for both trend and swing traders. It is now approaching a resistance line that has been tested before. Divergence watchers may be optimistic about a potential breakout, which could mark the start of a new […]
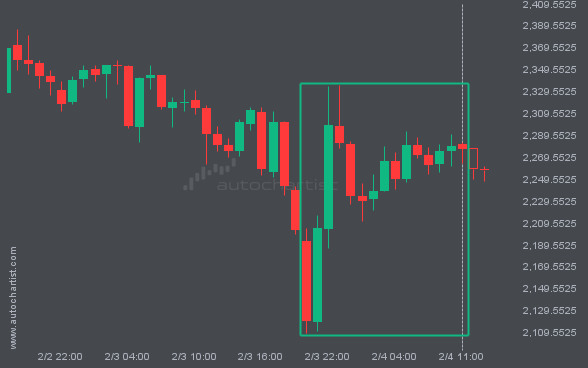
An emerging Triangle pattern in its final wave has been identified on the S&P500 4 hour chart. After a strong bearish run, S&P500 is heading toward the upper triangle trendline, with possible resistance at 6870.9042. If the support holds, the Triangle pattern suggests a rebound toward current levels.
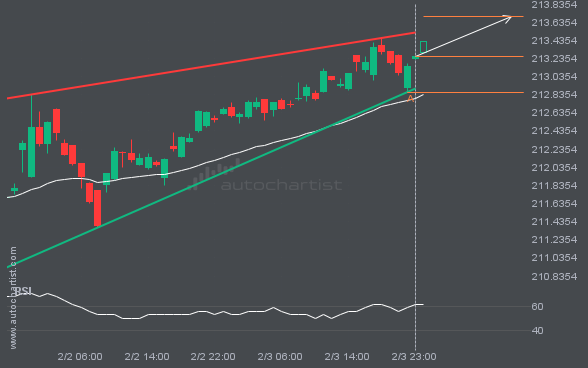
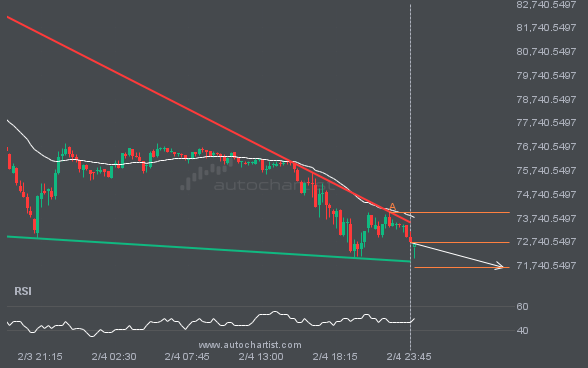
GBPJPY is heading toward the resistance line in a Rising Wedge pattern. If this move continues, the price of GBPJPY could test 213.6970 within the next 13 hours. It has tested this line many times before, so the move could be short-lived and may rebound as it has before.
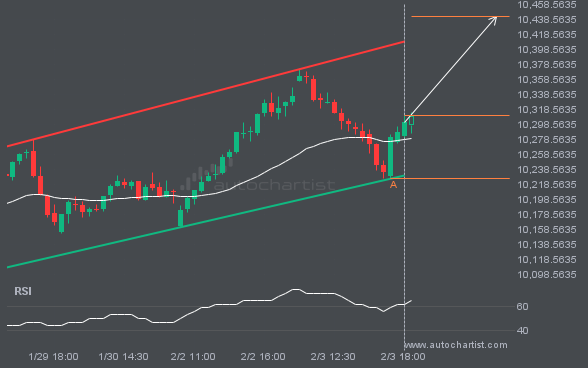
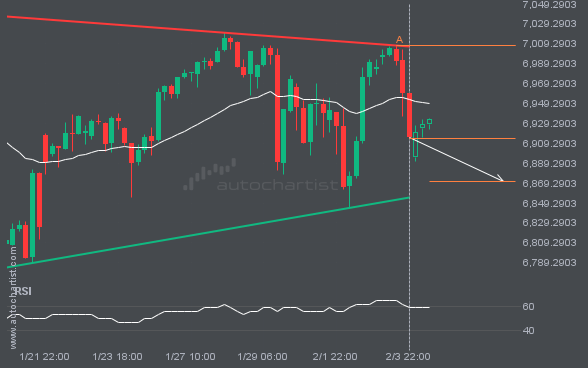
FTSE100 is heading toward the resistance line of a Channel Up pattern and could reach it within the next 8 hours. It has tested this line numerous times before, and this time may be no different, ending in a rebound instead of a breakout. If a breakout doesn’t occur, we could see a retracement back […]
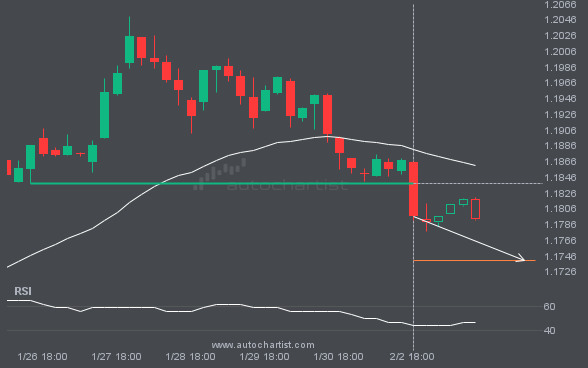
EURUSD has broken through a support line. Because it has previously retraced from this price, you should wait for confirmation of the breakout before trading. It has touched this line multiple times over the past 8 days, which suggests a possible target around 1.1740 within the next 8 hours.