Daily Top Trade Setups: Advanced Forex, Indices, Commodities, and Stock Analysis
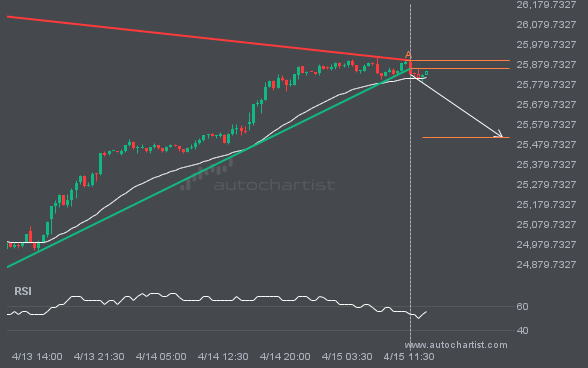
Support line has been breached by NAS100. This price level has been tested at least twice before.
The last 5 30 Minutes candles on NAS100 have formed a Triangle pattern and broken out through the pattern lines, indicating a possible bearish movement toward the price level at 25512.7749.
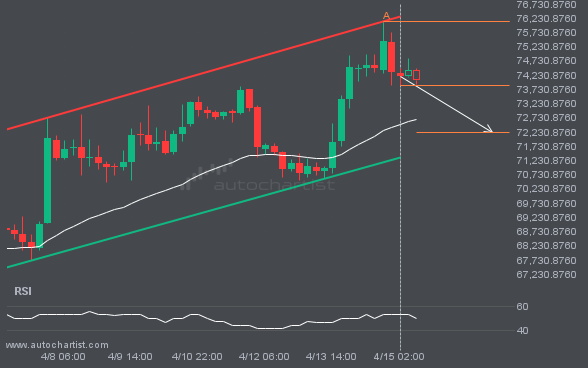
BTCUSD has formed a Channel Up on the 4 hour chart. A retest of support is in sight.
BTCUSD is moving toward a support line. Since it has retraced from this line before, we may see either a breakout through it or a rebound to current levels. It has touched this line multiple times in the past 12 days and may test it again within the next 3 days.
A Channel Down has formed, and NGC/USD is approaching resistance. Should we expect a breakout and the start of a new trend, or a reversal?
NGC/USD is moving toward a support line it has tested many times. It has retraced from this line before, so it’s unclear whether it will break through or rebound again. If NGC/USD continues on its current trajectory, it could reach 2.4976 within the next 3 days.
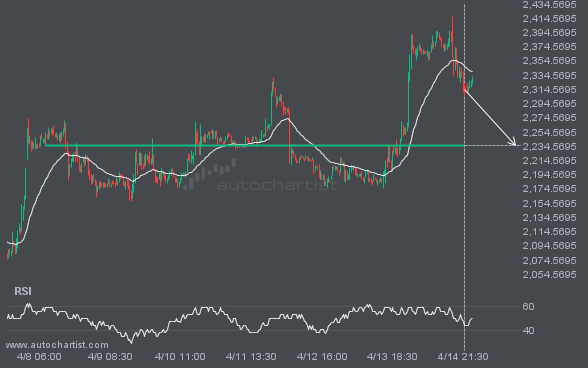
ETHUSD is likely to test 2235.7000 in the near future. Where to next?
ETHUSD is moving toward a level at 2235.7000, which it has tested many times before. We have seen it retrace from this level before, so at this stage it isn’t clear whether it will break through this price or rebound again. If ETHUSD continues on its current trajectory, we may see it move toward 2235.7000 […]
GBPJPY has formed a Channel Up on the 1 hour chart. A retest of resistance is in sight.
GBPJPY is moving toward a resistance line. Since it has retraced from this line before, we may see either a breakout through this line or a rebound to current levels. It has touched this line numerous times in the last 6 days and may test it again within the next 8 hours.
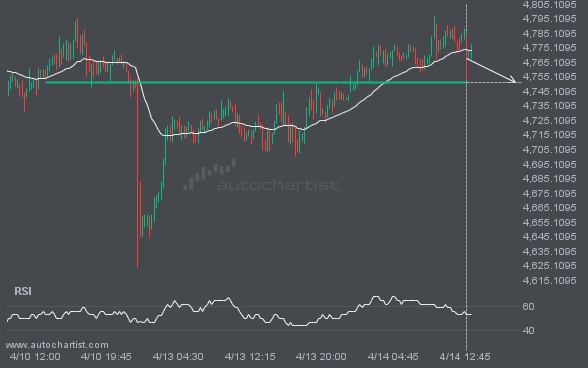
XAUUSD keeps moving closer to 4751.1050. Will it finally breach this level?
XAUUSD is moving toward a key support level at 4751.1050. This level has been tested before for XAUUSD. This may present a good trading opportunity either at the spot price or after a breakout through this level.
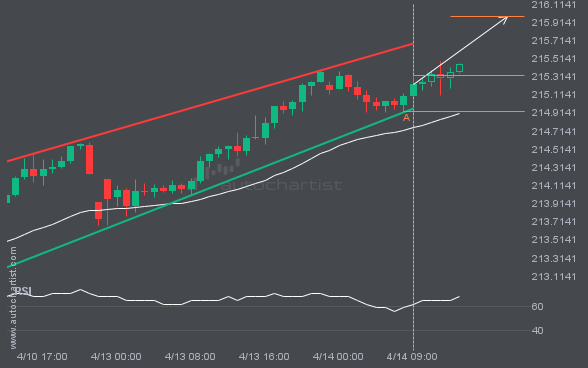
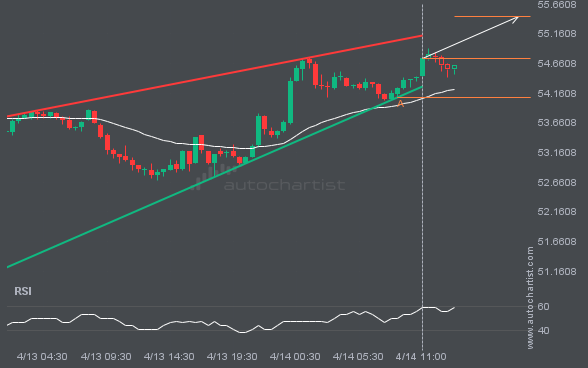
LTCUSD is approaching a resistance line of a Rising Wedge. It has touched this line numerous times in the last 2 days.
An emerging Rising Wedge has been detected on LTCUSD. The pattern has not yet broken through support, but the price is expected to move up over the next few hours. At the time the pattern was found, the price was 54.75, and it is expected to move to 55.4495.
Latest company news, corporate actions and partnership announcements
Interesting trading articles, ideas, and thought leadership
Ask your broker today or sign up for a demo from the Technical Analysis page.