Skip to content
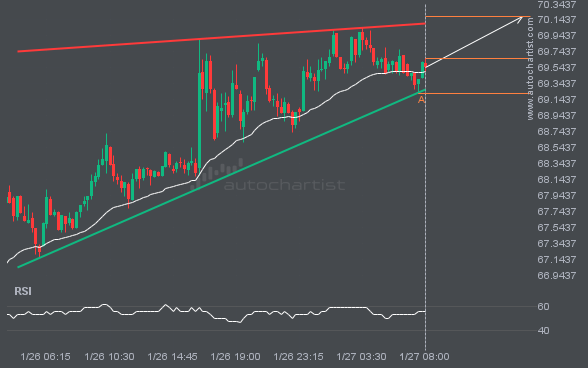
 XAUUSD is heading toward the resistance line of a Channel Up pattern and could reach it within the next 2 days. It has tested this line numerous times before, and this time may be no different, ending in a rebound instead of a breakout. If a breakout doesn’t occur, we could see a retracement back […]
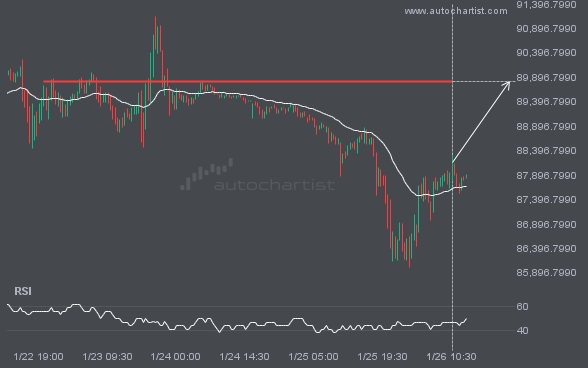
BRN/USD is moving toward a support line. Because it has retraced from this level in the past, we may see either a breakout through this line or a rebound to current levels. It has touched this line multiple times over the last 16 days and may test it again within the next 3 days.
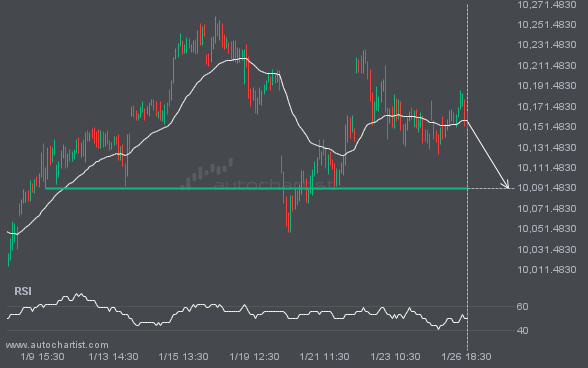
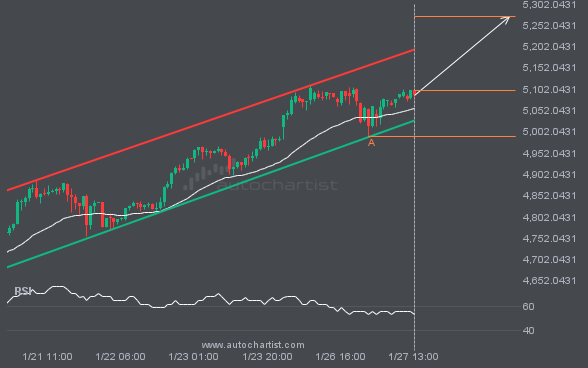
FTSE100 is moving toward a level at 10091.4600, which it has tested many times before. We have seen it retrace from this level before, so at this stage it isn’t clear whether it will break through this price or rebound again. If FTSE100 continues on its current trajectory, we may see it move toward 10091.4600 […]
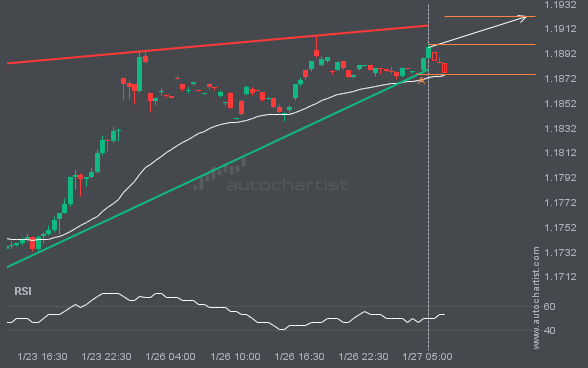
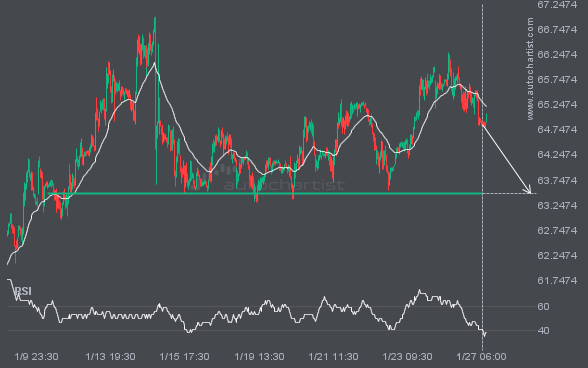
EURUSD is moving toward a resistance line it has tested many times. It has retraced from this line before, so it’s unclear whether it will break through or rebound again. If EURUSD continues on its current trajectory, it could reach 1.1922 within the next 9 hours.
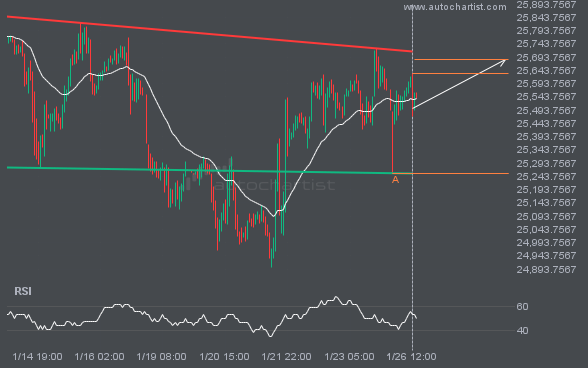
An emerging Inverse Head and Shoulders has been detected on NAS100. The pattern has not yet broken through support, but the price is expected to move up over the next few hours. At the time the pattern was found, the price was 25632.8793, and it is expected to move to 25684.9496.