Skip to content
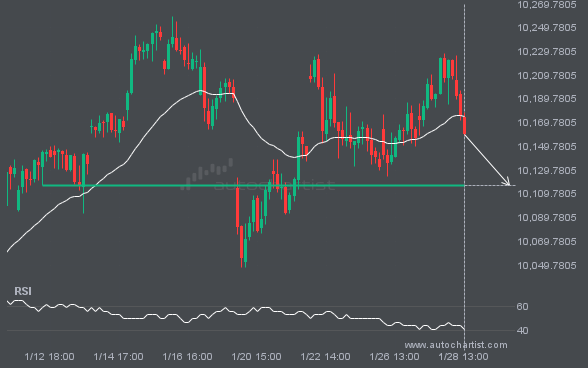
FTSE100 is approaching the line at 10116.5996. If this move continues, the price of FTSE100 could test 10116.5996 within the next 2 days. But do not rush to trade. It has tested this line many times in the past, so the move could be short-lived and end in a rebound.
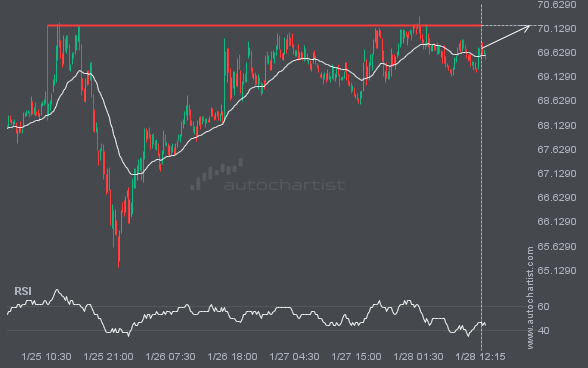
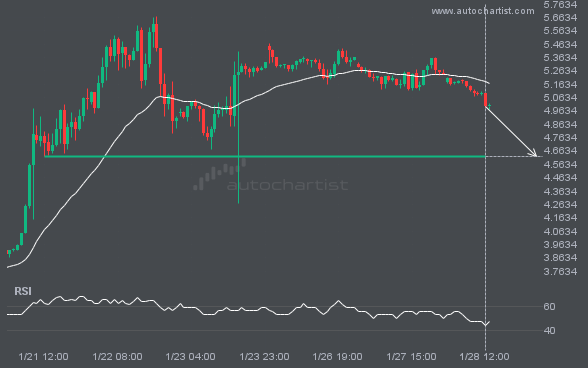
The movement of LTCUSD towards the 70.1900 price line is yet another test of a line it has reached numerous times in the past. We can expect this test to occur within the next 17 hours, but it is uncertain whether it will result in a breakout through this line or simply rebound to current […]
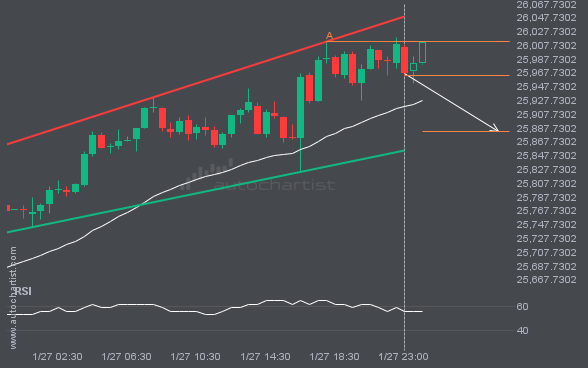
An emerging Channel Up pattern in its final wave has been identified on the NAS100 30 Minutes chart. After a strong bearish run, NAS100 is heading toward the upper triangle trendline, with possible resistance at 25882.5954. If the support holds, the Channel Up pattern suggests a rebound toward current levels.
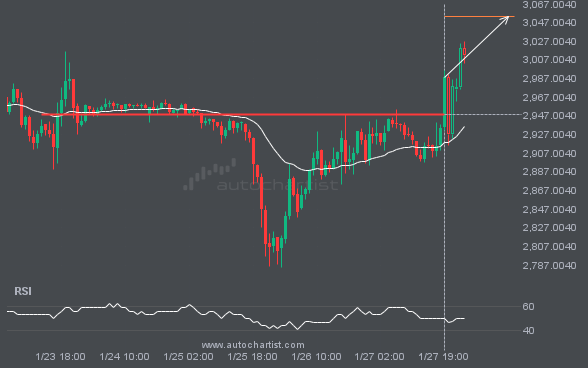
The breakout of ETHUSD through the 2948.7900 price line is a breach of an important psychological price level that it has tested numerous times in the past. If this breakout persists, ETHUSD could test 3053.5471 within the next 19 hours. One should always be cautious before placing a trade and wait for confirmation of the […]
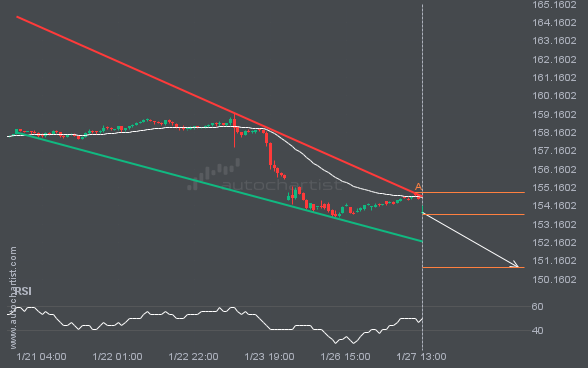
An emerging Falling Wedge pattern has been detected for USDJPY on the 1 hour chart. There may be a move toward 150.7935 in the next few candles. Once it reaches the support, it may continue its bearish run or revert to current price levels.
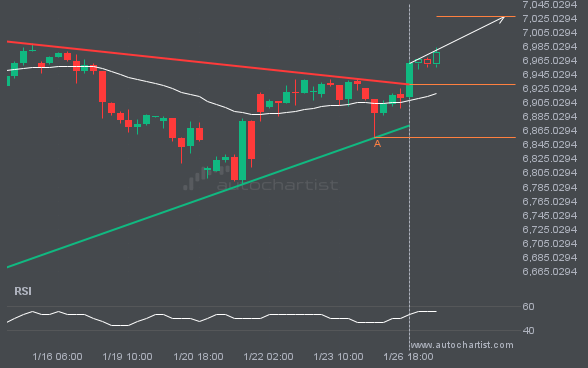
S&P500 has broken through the resistance line of a Triangle technical chart pattern. Because it has retraced from this line in the past, you should wait for confirmation of the breakout before taking any action. It has touched this line twice in the last 13 days, suggesting a possible target level around 7027.2055 within the […]