Daily Top Trade Setups: Advanced Forex, Indices, Commodities, and Stock Analysis
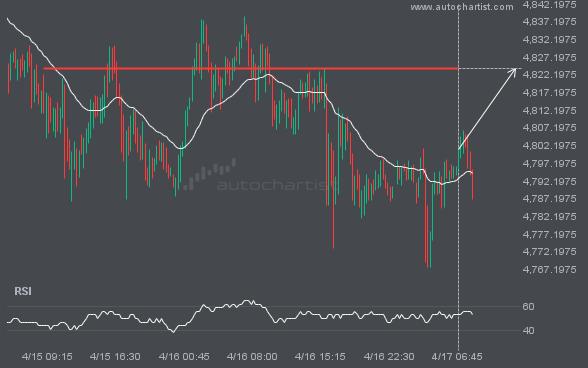
An important price level is being approached by XAUUSD. This price level has been tested numerous times before.
XAUUSD is about to retest a key horizontal resistance level near 4824.0449. It has tested this level 3 times recently and may simply bounce off it, as it did last time. However, after so many attempts, it may be ready to start a new trend.
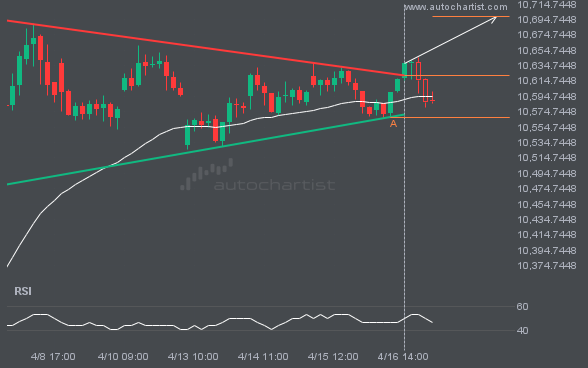
Bulls aim for 10698.4417 after FTSE100 triggered a bullish formation on the 1 hour chart.
FTSE100 has broken through the resistance line of a Triangle pattern and suggests a possible move to 10698.4417 within the next 13 hours. It has tested this line before, so it is prudent to wait for confirmation of the breakout before taking action. If the breakout is not confirmed, we could see a retracement back […]
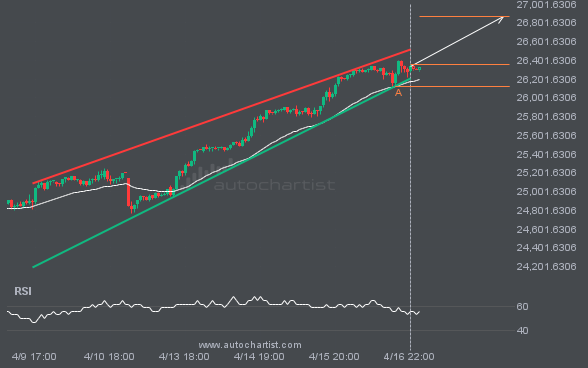
After repeatedly testing the resistance line, NAS100 is once again approaching it. Can we expect a bullish trend to emerge?
An emerging Channel Up pattern has been detected for NAS100 on the 1 hour chart. There may be a move toward 26867.8875 in the next few candles. Once it reaches the resistance, it may continue its bullish run or revert to current price levels.
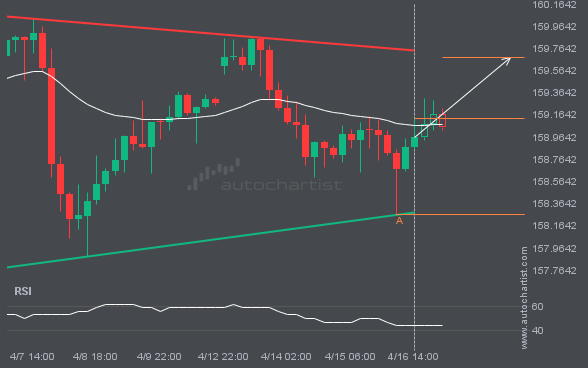
Consider a move on USDJPY as it heads toward resistance.
USDJPY was identified around 159.1315 after recently rebounding off the support on the 4 hour interval. Ultimately, the stock’s price action has formed a Triangle pattern. This squeeze may increase the chances of a strong breakout. The projected move could take the price to around 159.6782.
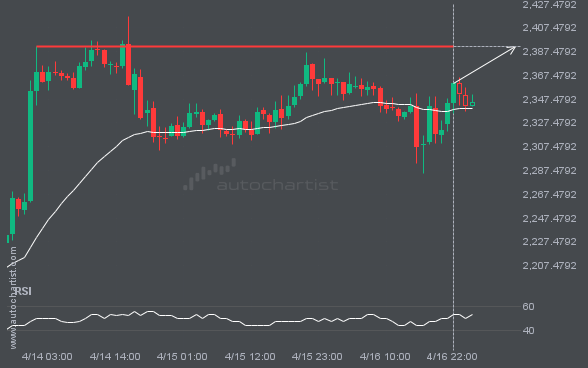
ETHUSD is heading toward a price it has tested 3 times recently.
A strong resistance level has been identified at 2391.4399 on the 1 hour ETHUSD chart. ETHUSD is likely to test this level soon.
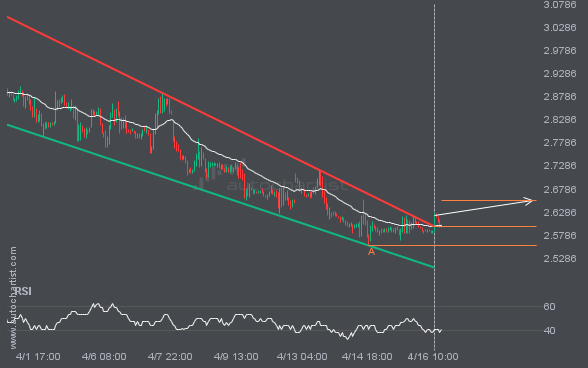
NGC/USD has broken through the resistance of a Falling Wedge. It has touched this line at least twice in the last 16 days.
A breakout of NGC/USD through the resistance line of a Falling Wedge could signal what’s ahead. If the breakout persists, we may see NGC/USD’s price test 2.6545 within the next 3 days.
BTCUSD appears to be approaching support—a potential opportunity?
BTCUSD is moving toward a level at 73862.1406, which it has tested many times before. We have seen it retrace from this level before, so at this stage it isn’t clear whether it will break through this price or rebound again. If BTCUSD continues on its current trajectory, we may see it move toward 73862.1406 […]
Latest company news, corporate actions and partnership announcements
Interesting trading articles, ideas, and thought leadership
Ask your broker today or sign up for a demo from the Technical Analysis page.