Daily Top Trade Setups: Advanced Forex, Indices, Commodities, and Stock Analysis
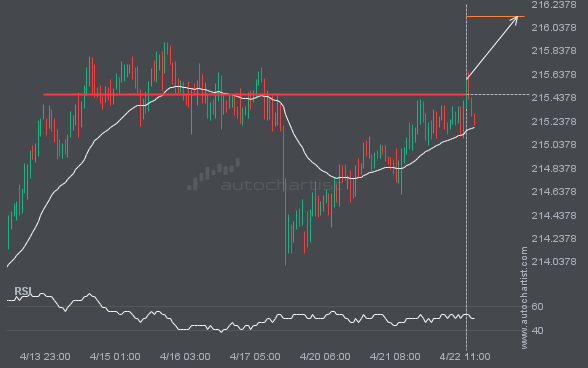
GBPJPY has broken through a level it has tested 3 times recently.
GBPJPY has broken through 215.4680, which it has tested many times before. We have also seen it retrace from this level. If this new trend persists, GBPJPY may be heading towards 216.1308 within the next 2 days.
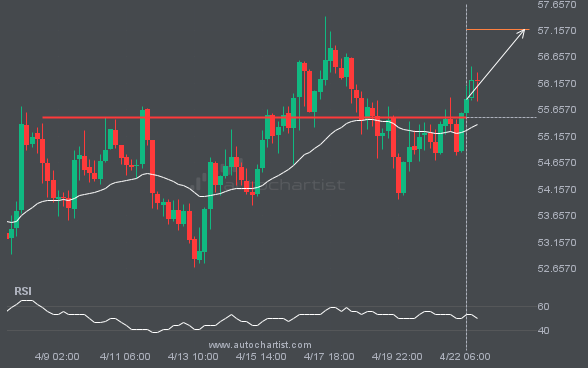
It’s time to decide about LTCUSD—its recent breach of 55.5200 could signal a new trend.
LTCUSD has breached the resistance line at 55.5200. It may continue the bullish trend toward 57.1740, or it may be yet another test of this level.
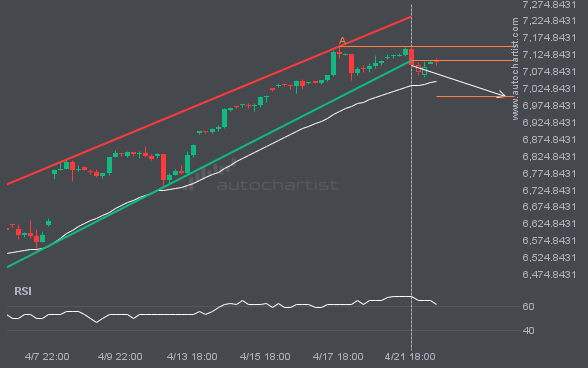
S&P500 has broken through the support of a Channel Up. It has touched this line at least twice in the last 21 days.
S&P500 has broken through a support line of the Channel Up chart pattern. If this breakout holds, we may see the price of S&P500 test 7000.6465 within the next 3 days. But don’t rush to trade. It has tested this line before, so confirm the breakout before taking any action.
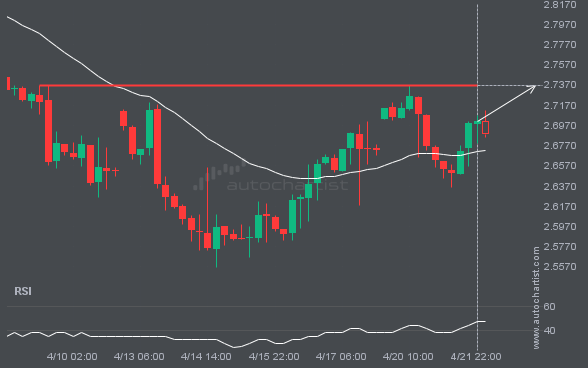
After repeatedly testing the 2.7365 level, NGC/USD is once again approaching it. Should we expect a bullish trend to follow?
NGC/USD is moving toward a resistance line. Because it has retraced from this level in the past, we may see either a breakout through this line or a rebound to current levels. It has touched this line multiple times over the last 13 days and may test it again within the next 2 days.
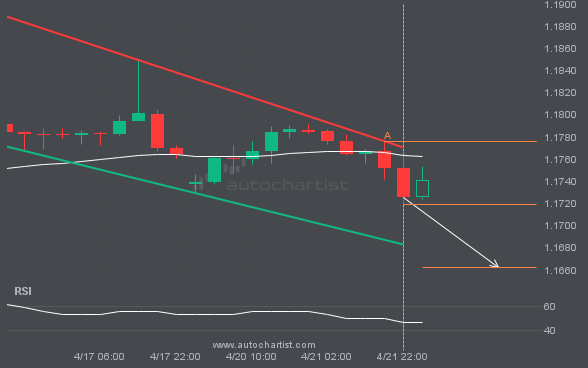
EURUSD is approaching a support line of a Channel Down. It has touched this line numerous times in the last 6 days.
EURUSD is trapped in a Channel Down formation, implying that a breakout is imminent. This is a strong trade setup for both trend and swing traders. It is now approaching a resistance line that has been tested before. Divergence watchers may be optimistic about a potential breakout, which could mark the start of a new […]
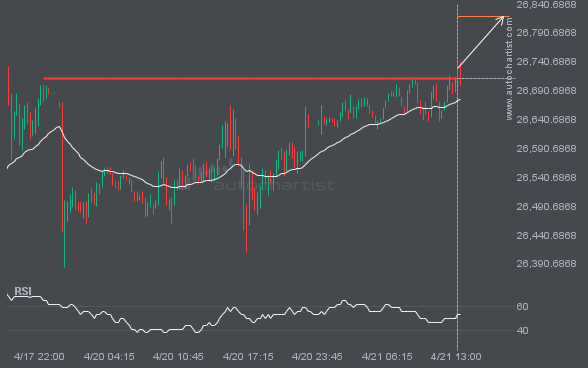
NAS100 is currently testing the 26711.9629 level. Will the breakout continue, or will it reverse?
NAS100 has broken through a resistance line. Since it has previously retraced from this price, wait for confirmation of the breakout before trading. It has touched this line several times over the past 4 days. This suggests a possible target around 26818.9688 within the next 9 hours.
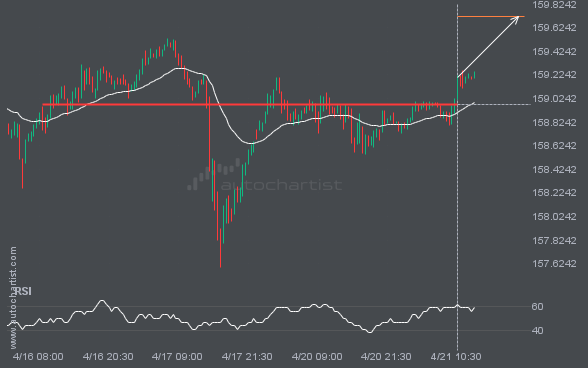
Significant movement is possible in USDJPY after a breach of 158.9740.
The breakout of USDJPY through the 158.9740 price line is a breach of an important psychological price level that it has tested numerous times in the past. If this breakout persists, USDJPY could test 159.7179 within the next 15 hours. One should always be cautious before placing a trade and wait for confirmation of the […]
Latest company news, corporate actions and partnership announcements
Interesting trading articles, ideas, and thought leadership
Ask your broker today or sign up for a demo from the Technical Analysis page.