Daily Top Trade Setups: Advanced Forex, Indices, Commodities, and Stock Analysis
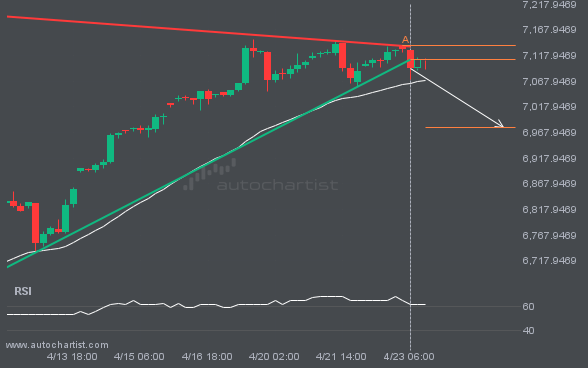
S&P500 has broken through the support of a Triangle. It has touched this line at least twice in the last 15 days.
S&P500 has broken through the support line of a Triangle technical chart pattern. Because it has retraced from this line in the past, you should wait for confirmation of the breakout before taking any action. It has touched this line twice in the last 15 days, which suggests a possible target around 6977.1544 within the […]
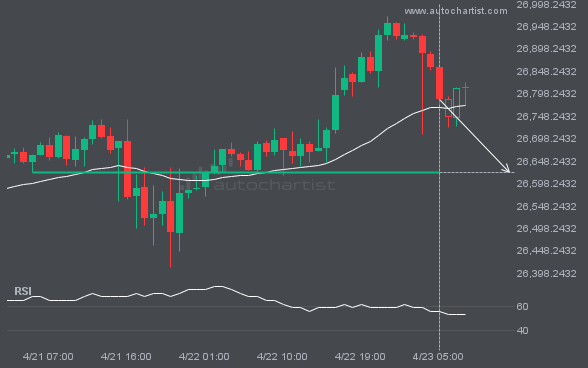
An important price level is being approached by NAS100. This price level has been tested numerous times before.
NAS100 is moving toward a key support level at 26623.2422. This level has been tested before for NAS100. This may present a good trading opportunity either at the spot price or after a breakout through this level.
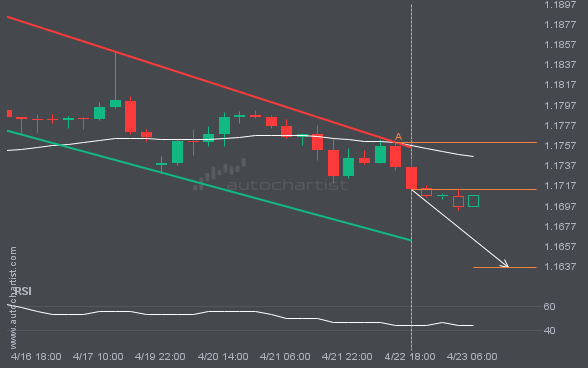
EURUSD has formed a Channel Down on the 4 hour chart. A retest of support is in sight.
EURUSD is moving toward a support line. Since it has retraced from this line before, we may see either a breakout through it or a rebound to current levels. It has touched this line multiple times in the past 7 days and may test it again within the next 15 hours.
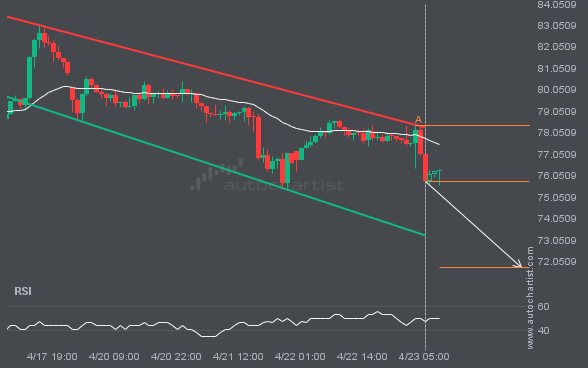
Consider a move on XAGUSD as it heads toward support.
An emerging Channel Down has been detected on XAGUSD. The pattern has not yet broken through resistance, but the price is expected to move up over the next few hours. At the time the pattern was found, the price was 75.785, and it is expected to move to 71.7967.
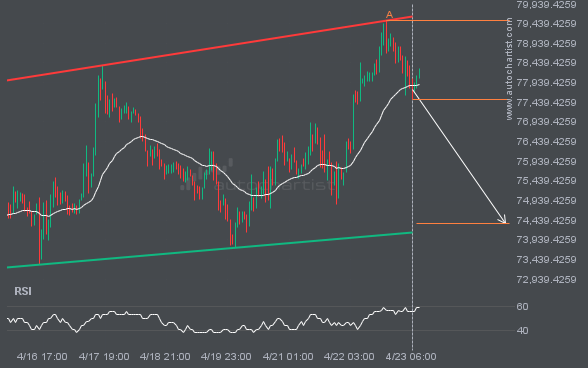
BTCUSD is signaling a possible trend reversal on intraday charts, as the price fails to breach resistance.
BTCUSD is moving toward a support line. Since it has retraced from this line before, we may see either a breakout through it or a rebound to current levels. It has touched this line multiple times in the past 8 days and may test it again within the next 3 days.
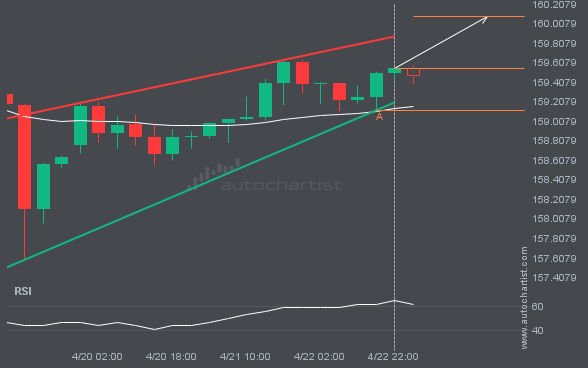
An important resistance line is being approached by USDJPY. This price has been tested numerous times in the last 7 days
USDJPY was identified around 159.5515 after recently rebounding off the support on the 4 hour interval. Ultimately, the stock’s price action has formed a Rising Wedge pattern. This squeeze may increase the chances of a strong breakout. The projected move could take the price to around 160.0795.
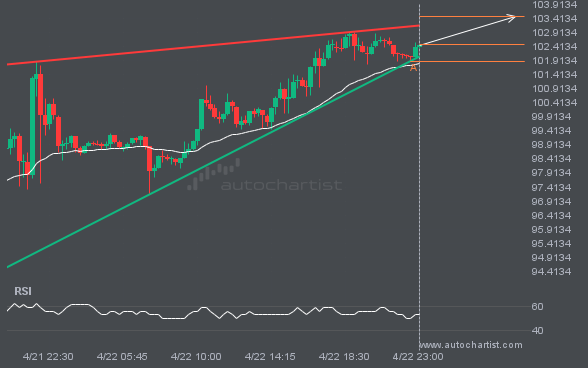
BRN/USD has formed a Rising Wedge on the 15 Minutes chart. A retest of resistance is in sight.
BRN/USD is heading toward the resistance line in a Rising Wedge pattern. If this move continues, the price of BRN/USD could test 103.4679 within the next 7 hours. It has tested this line many times before, so the move could be short-lived and may rebound as it has before.
Latest company news, corporate actions and partnership announcements
Interesting trading articles, ideas, and thought leadership
By Robain Polly, Product Evangelist and Resident Snake Charmer, Autochartist.com I collect venomous snakes as a hobby; my collection includes adders, vipers and cobras. I spend hours studying and looking after them. I have often decided to quit, and a few weeks later I find myself getting new snakes just because they are pretty or […]
By Jingwei Li, Researcher, Autochartist.com Some brokers simply take the position of “take on as much risk as possible and therefore maximize profitability”, while others assume a more moderate approach of balancing the liquidity of their company with profitability. In this short article we investigate the use of a sentiment-based indicator to assist brokers in […]
Autochartist is proud to announce that it has concluded the acquisition of a controlling stake in Delkos Research (www.delkos.com) – a company providing forecasts and content for Futures and Forex brokers based around macro-economic news events. This is the second acquisition that Autochartist has concluded in 2018. Delkos’s News Events Trading Services (NETS) allows traders to […]