Skip to content
 BTCUSD is heading toward the resistance line of a Channel Down pattern and could reach it within the next 6 hours. It has tested this line numerous times before, and this time may be no different, ending in a rebound instead of a breakout. If a breakout doesn’t occur, we could see a retracement back […]
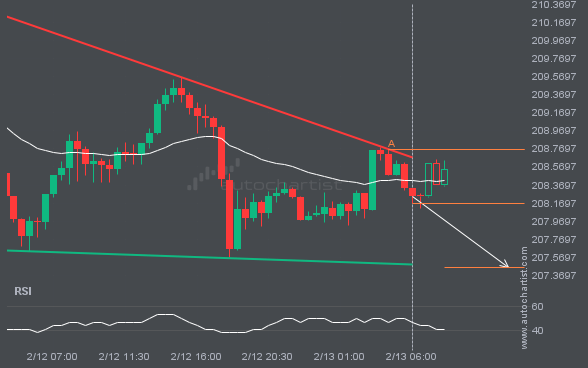
An emerging Descending Triangle pattern in its final wave has been identified on the GBPJPY 30 Minutes chart. After a strong bearish run, GBPJPY is heading toward the upper triangle trendline, with possible resistance at 207.4598. If the support holds, the Descending Triangle pattern suggests a rebound toward current levels.
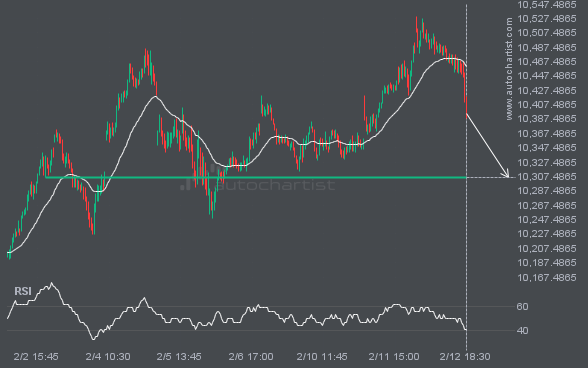
FTSE100 is heading toward 10305.5098 and could reach this level within the next 17 hours. It has tested this level numerous times in the past, and this time could be no different, ending in a rebound rather than a breakout. If a breakout does not occur, we may see a retracement back to current levels.
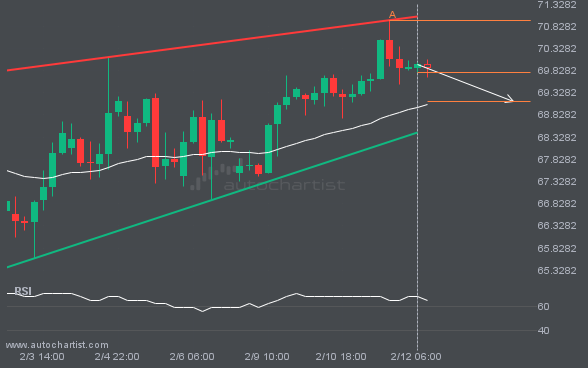
A Rising Wedge pattern was identified for BRN/USD at 69.774, suggesting it may move toward the support line at 69.1426. It may break through that line and continue the bearish trend, or reverse from it.
By Laurence Fish, Developer, Autochartist.com Price data is central to our business in the drawing of the charts and the
By Robain Polly, Product Evangelist and Resident Snake Charmer, Autochartist.com I collect venomous snakes as a hobby; my collection includes adders, vipers and cobras. I spend hours studying and looking after them. I have often decided to quit, and a few weeks later I find myself getting new snakes just because they are pretty or […]
By Jingwei Li, Researcher, Autochartist.com Some brokers simply take the position of “take on as much risk as possible and therefore maximize profitability”, while others assume a more moderate approach of balancing the liquidity of their company with profitability. In this short article we investigate the use of a sentiment-based indicator to assist brokers in […]

Autochartist is proud to announce that it has concluded the acquisition of a controlling stake in Delkos Research (www.delkos.com) – a company providing forecasts and content for Futures and Forex brokers based around macro-economic news events. This is the second acquisition that Autochartist has concluded in 2018. Delkos’s News Events Trading Services (NETS) allows traders to […]