Daily Top Trade Setups: Advanced Forex, Indices, Commodities, and Stock Analysis
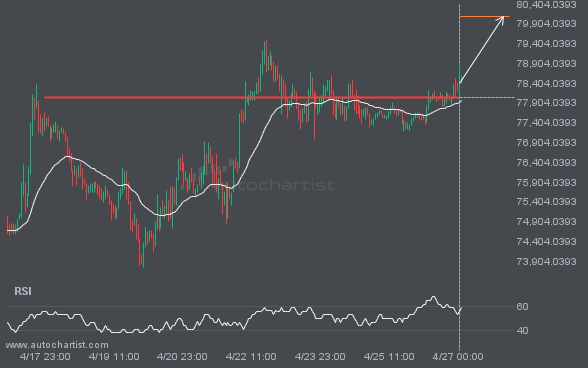
BTCUSD has broken through a level it has tested 4 times recently.
A strong resistance level has been breached at 78030.2500 on the 1 hour BTCUSD chart. Technical analysis forecasts a move to 80087.0703 within the next 2 days.
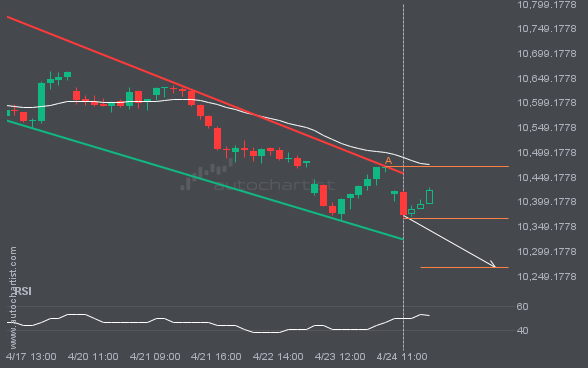
Because FTSE100 has formed a Channel Down pattern, we expect it to touch the support line. If it breaks through the support, it may move much lower.
FTSE100 is moving toward a support line it has tested many times. It has retraced from this line before, so it’s unclear whether it will break through or rebound again. If FTSE100 continues on its current trajectory, it could reach 10266.8450 within the next 10 hours.
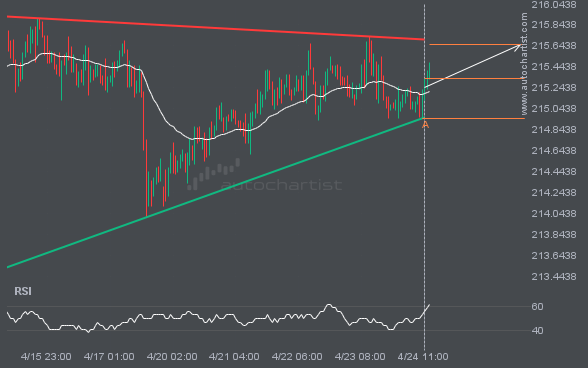
After repeatedly testing the resistance line, GBPJPY is once again approaching it. Can we expect a bullish trend to emerge?
GBPJPY is heading toward the resistance line in a Triangle pattern. If this move continues, the price of GBPJPY could test 215.6588 within the next 3 days. It has tested this line many times before, so the move could be short-lived and may rebound as it has before.
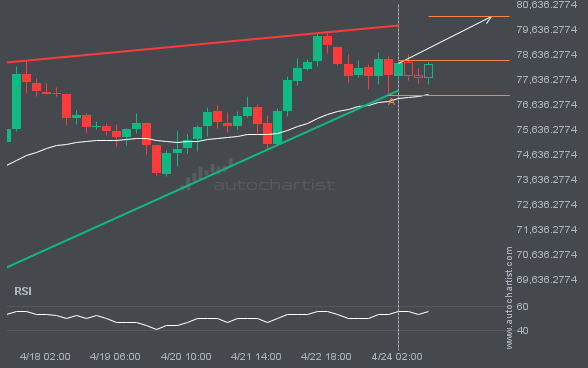
BTCUSD is approaching a resistance line of a Rising Wedge. It has touched this line numerous times in the last 8 days.
An emerging Rising Wedge pattern in its final wave has been identified on the BTCUSD 4 hour chart. After a strong bullish run, BTCUSD is heading toward the upper triangle trendline, with possible resistance at 80134.8675. If the resistance holds, the Rising Wedge pattern suggests a rebound toward current levels.
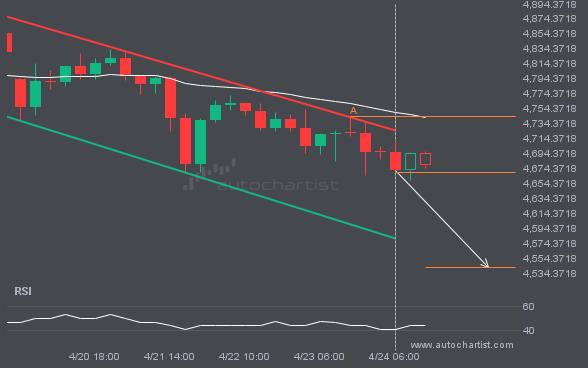
XAUUSD is approaching a support line of a Channel Down. It has touched this line numerous times in the last 7 days.
The movement of XAUUSD toward the support line of a Channel Down is yet another test of the line it has reached numerous times in the past. This test of the line could occur within the next 22 hours, but it is uncertain whether it will result in a breakout through this line or simply […]
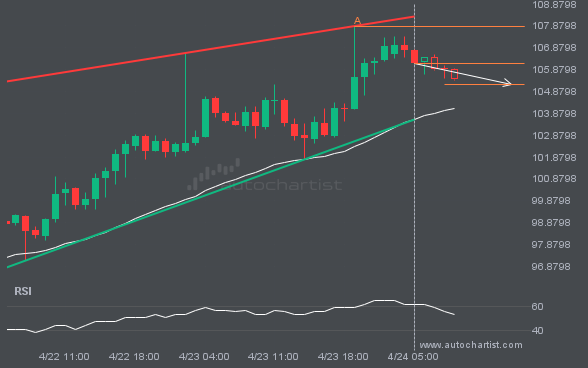
BRN/USD is approaching the support line of a Rising Wedge pattern. We anticipate either a breakout through this line or a rebound.
BRN/USD was identified around 106.163 after recently rebounding off the resistance on the 1 hour interval. Ultimately, the stock’s price action has formed a Rising Wedge pattern. This squeeze may increase the chances of a strong breakout. The projected move could take the price to around 105.1965.
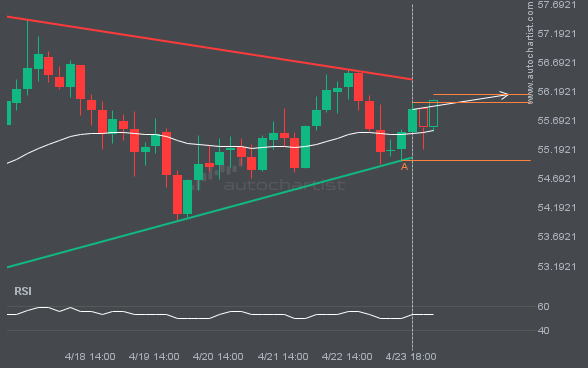
LTCUSD is signaling a possible trend reversal on intraday charts, as the price fails to breach support.
A Triangle pattern was identified for LTCUSD at 56.0, suggesting it may move toward the resistance line at 56.1450. It may break through that line and continue the bullish trend, or reverse from it.
Latest company news, corporate actions and partnership announcements
Interesting trading articles, ideas, and thought leadership
By Rhonda Truter, To date, the Autochartist suite of products is available in 28 languages, 10 of which have been added over the past 4 years. I will share how exactly we have accomplished this and what difficulties we have faced along the way. If you’re about to embark on a multi-language development project I […]
The future of the financial industry is changing fast with the ever increasing use of social media platforms. The impact of social media combined with big data has opened up new opportunities for stock brokers, futures brokers and forex brokers; not only to enhance their communication with clients but to also increase their exposure, brand […]
By Ilan Azbel, CEO, Autochartist. I would say that I’m a pretty confident public speaker; of course I’m not a professional, but put me on a stage in front of a few hundred people and I’ll be happy to speak for hours. I love sharing knowledge, especially in my field of expertise. So when I […]
How to enhance your lead generation process and generate more business leads. 5 + 1 Tips to increase Lead-Acquisition for your Brokerage Fx brokers are continuously investing in improving their lead generation processes and how their lead funnels can be enhanced to achieve maximum results. Some of the most widely used tactics in the past were focused on added value via […]
By Kobus Steenekamp, CTO, Autochartist Don’t get me wrong, we love AWS, and we use a ton of great products from them, but when it comes to cost control, it can easily get out of hand. Case in point, AWS’s CloudWatch. Like any tech team, we are constantly under pressure to do more cool stuff, […]
In today’s fast paced online environment, the financial industry is always trying to keep up to date with the latest news. The concept of Natural Language Generation (NLG) is echoing strongly in the industry as Fx brokers are seeking new ways to reach a larger audience with the right message. But what is NLG? Natural language generation software uses […]