Skip to content
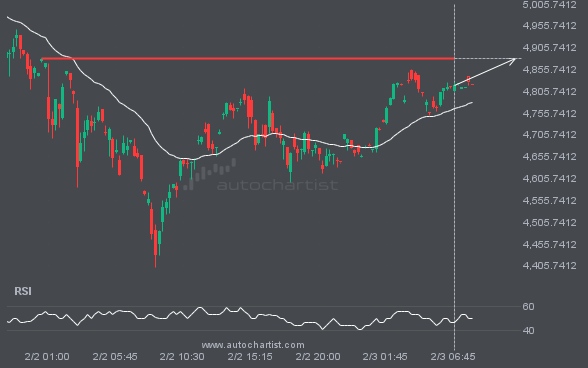
 An emerging Triangle pattern in its final wave has been identified on the S&P500 4 hour chart. After a strong bearish run, S&P500 is heading toward the upper triangle trendline, with possible resistance at 6870.9042. If the support holds, the Triangle pattern suggests a rebound toward current levels.
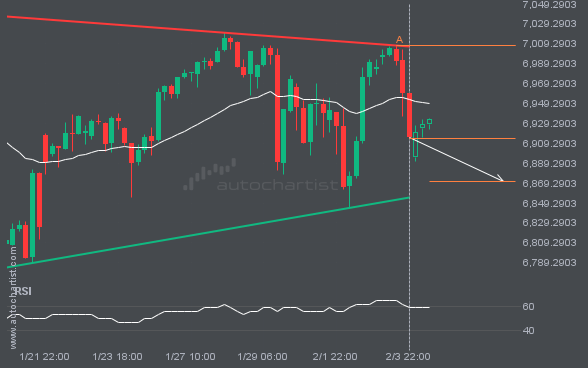
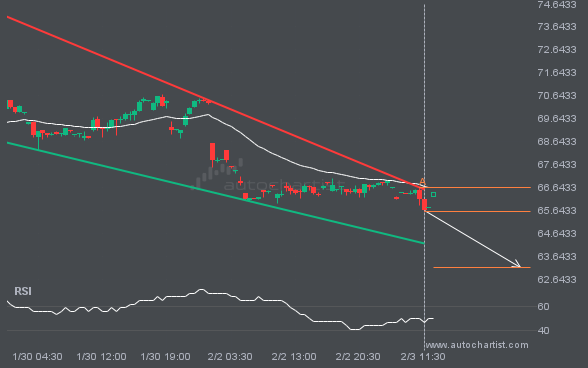
GBPJPY is heading toward the resistance line in a Rising Wedge pattern. If this move continues, the price of GBPJPY could test 213.6970 within the next 13 hours. It has tested this line many times before, so the move could be short-lived and may rebound as it has before.
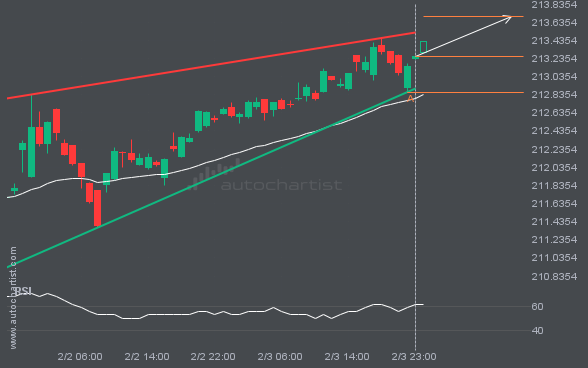
FTSE100 is heading toward the resistance line of a Channel Up pattern and could reach it within the next 8 hours. It has tested this line numerous times before, and this time may be no different, ending in a rebound instead of a breakout. If a breakout doesn’t occur, we could see a retracement back […]
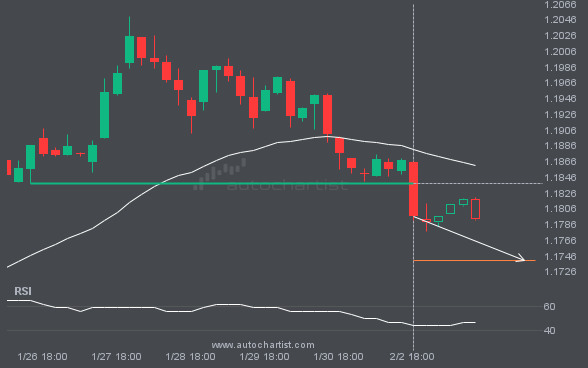
EURUSD has broken through a support line. Because it has previously retraced from this price, you should wait for confirmation of the breakout before trading. It has touched this line multiple times over the past 8 days, which suggests a possible target around 1.1740 within the next 8 hours.
BRN/USD is moving toward a support line it has tested many times. It has retraced from this line before, so it’s unclear whether it will break through or rebound again. If BRN/USD continues on its current trajectory, it could reach 63.1494 within the next 12 hours.
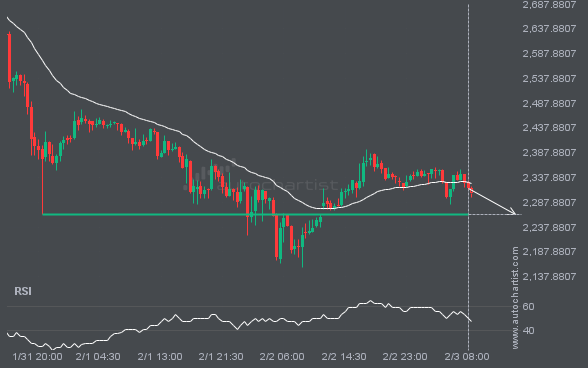
ETHUSD is approaching a critical level that could be a key deciding factor for what comes next. We may see this trajectory continue to test and break through 2264.1799, unless it loses momentum and pulls back to current levels.
Social media platforms can be a golden opportunity for forex brokers wishing to increase their lead generation. There is a
By Rhonda Truter, To date, the Autochartist suite of products is available in 28 languages, 10 of which have been added over the past 4 years. I will share how exactly we have accomplished this and what difficulties we have faced along the way. If you’re about to embark on a multi-language development project I […]

The future of the financial industry is changing fast with the ever increasing use of social media platforms. The impact of social media combined with big data has opened up new opportunities for stock brokers, futures brokers and forex brokers; not only to enhance their communication with clients but to also increase their exposure, brand […]
By Ilan Azbel, CEO, Autochartist. I would say that I’m a pretty confident public speaker; of course I’m not a professional, but put me on a stage in front of a few hundred people and I’ll be happy to speak for hours. I love sharing knowledge, especially in my field of expertise. So when I […]

How to enhance your lead generation process and generate more business leads. 5 + 1 Tips to increase Lead-Acquisition for your Brokerage Fx brokers are continuously investing in improving their lead generation processes and how their lead funnels can be enhanced to achieve maximum results. Some of the most widely used tactics in the past were focused on added value via […]

By Kobus Steenekamp, CTO, Autochartist Don’t get me wrong, we love AWS, and we use a ton of great products from them, but when it comes to cost control, it can easily get out of hand. Case in point, AWS’s CloudWatch. Like any tech team, we are constantly under pressure to do more cool stuff, […]
In today’s fast paced online environment, the financial industry is always trying to keep up to date with the latest news. The concept of Natural Language Generation (NLG) is echoing strongly in the industry as Fx brokers are seeking new ways to reach a larger audience with the right message. But what is NLG? Natural language generation software uses […]