MARKET ANALYSIS

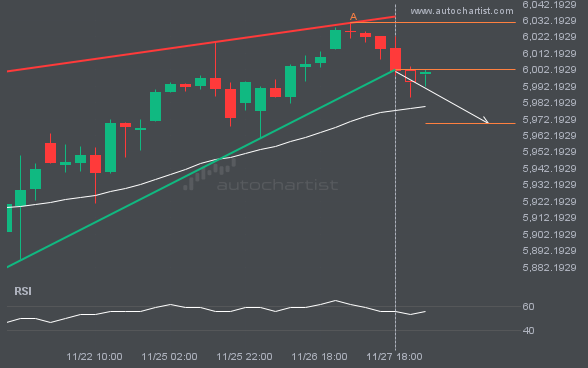
S&P500 moved through the support line of a Rising Wedge at 6002.303124999999 on the 4 hour chart. This line has been tested a number of times in the past and this breakout could mean an upcoming change from the current trend. It may continue in its current direction toward 5969.3006.

An emerging Triangle pattern in its final wave has been identified on the XAUUSD 1 hour chart. After a strong bearish run, XAUUSD is heading toward the upper triangle trendline, with possible resistance at 4680.1062. If the support holds, the Triangle pattern suggests a rebound toward current levels.

A Falling Wedge pattern was identified for ETHUSD at 2270.46, suggesting it may move toward the support line at 2255.0476. It may break through that line and continue the bearish trend, or reverse from it.

NAS100 is heading toward the resistance line in a Channel Up pattern. If this move continues, the price of NAS100 could test 29362.2249 within the next 3 days. It has tested this line many times before, so the move could be short-lived and may rebound as it has before.

XAGUSD is moving toward a resistance line. Since it has retraced from this line before, we may see either a breakout through this line or a rebound to current levels. It has touched this line numerous times in the last 7 days and may test it again within the next 2 days.

S&P500 is moving toward a support line. Since it has retraced from this line before, we may see either a breakout through this line or a rebound to current levels. It has touched this line numerous times in the last 9 days and may test it again within the next 2 days.

A strong resistance level has been identified at 113.3880 on the 15 Minutes BRN/USD chart. BRN/USD is likely to test this level soon.

The last 3 1 hour candles on NGC/USD have formed a Triangle pattern and broken out through the pattern lines, indicating a possible bullish movement toward the price level at 2.6716.